SUPPLY CHAIN LINKS: Analysis and insights from S&P Global Market Intelligence
Slowing U.S. economy to affect freight demand
S&P Global Market Intelligence expects U.S. freight tonnage growth to be less than the country’s GDP growth in 2024 due to reduced consumption and inventory building in the second half of the year.
The U.S. economy will end 2024 with weaker demand being met by largely adequate inventories. From a supply chain perspective this means that shippers can expect sufficient freight capacity, with continued adequate distribution center and warehousing availability.
In the last few years, transportation and logistics services providers added capacity in response to the boom in the purchase of goods and shipping during the pandemic. Those capacity additions remain, especially in trucking, where carriers have been slow to downsize or exit the industry, leading to excess capacity and low rates.
Weaknesses in manufacturing, housing starts, and business fixed investment are among the combination of factors leading to slower economic growth in the second half of 2024. However, low unemployment and resilient consumer spending means that the economy is still experiencing wage and price inflation above the U.S. Federal Reserve Board’s target of 2%.
Due to persistent inflation, especially in services, we expect that the Federal Reserve Board won’t reduce interest rates until December of 2024. As a result, capital costs will continue to be elevated for longer than expected. The slower economic growth will provide a headwind to freight demand that derives from consumer and business spending, manufacturing, and inventory building.
Slowing economic growth
The S&P Global Market Intelligence 2024 U.S. macroeconomic baseline forecast is for real gross domestic product (GDP) growth of 2.5%, about the same as for 2023. However, the pace of growth will slow through the rest of the year, where the relatively strong first two quarters of the year will be followed by two quarters averaging 1.7% annual growth. No recession is in the forecast, but the weakness in the U.S. economy will continue next year with real GDP growth of 1.6% in 2025, primarily due to the Federal Reserve Board focusing its monetary policy on reducing inflation to its 2% target.
Consumption in the economy is a key driver of freight demand, especially goods consumption. (Although services consumption does indirectly generate associated freight demand.) Consumption is now forecasted to slow to a 2% annual growth rate for the third and fourth quarters of 2024, following an average growth of 2.7% in the first two quarters of 2024. Sustained employment levels and growth in equity and home values supported household consumption spending in the first half of the year. However, we anticipate that consumption levels will moderate as the lagged effects of higher interest rates and declining residential investment dampen consumer demand. The inflation fight is forecasted to be won in 2025 but at the cost of below-potential economic growth, including unemployment rising to 4.2% by the end of 2025.
Interest rate increases are reducing consumer demand by raising the cost of credit. For durable goods purchases, such as autos financed with loans or homes financed with mortgages, lender limits on consumers’ debt service-to-income ratios constrain purchases consumers can qualify for. The higher mortgage rates will lead to a downturn in residential fixed investment in the second half of 2024. Housing starts will end the year at 1.4 million, below the 2023 level. The weakness in residential investment will be accompanied by weaker associated furniture and home furnishings markets.
Interest rate increases are affecting business, where the higher costs of capital reduce firms’ capacities to afford new plants and equipment or invest in substantial safety stock inventory. Business fixed investment is expanding but at a slower pace, forecasted to grow 2.9% in 2024 compared with the 4.5% pace of growth seen in 2023. For some businesses that are dealing with higher costs from inflation, increased capital costs can result in a negative cash flow or even insolvency. Some new-entrant truckers, who paid high prices for new equipment in the 2021–2022 boom, have become vulnerable in this higher-interest rate, lower-growth environment, which has led to contractions in for-hire trucking capacity. Trucking supply, however, still exceeds demand.
Weak U.S. freight outlook
Based on the forecasted demand for goods and inventory levels, we expect U.S. freight volumes to start mixed and end the year mostly weaker. The pace of consumption and inventory rebuilding seen in the first half of 2024 won’t be sustained all year, leading to demand and freight tonnage growth less than GDP growth. The S&P Global Transearch baseline forecast overall is for freight tonnage to increase 1.7% for 2024.
Not all freight modes have the same prospects. As Figure 1 shows the range of modal tonnage growth forecasts vary from a 1.5% drop in rail carload tonnage up to a rebound of 2.4% growth in total truck tonnage.
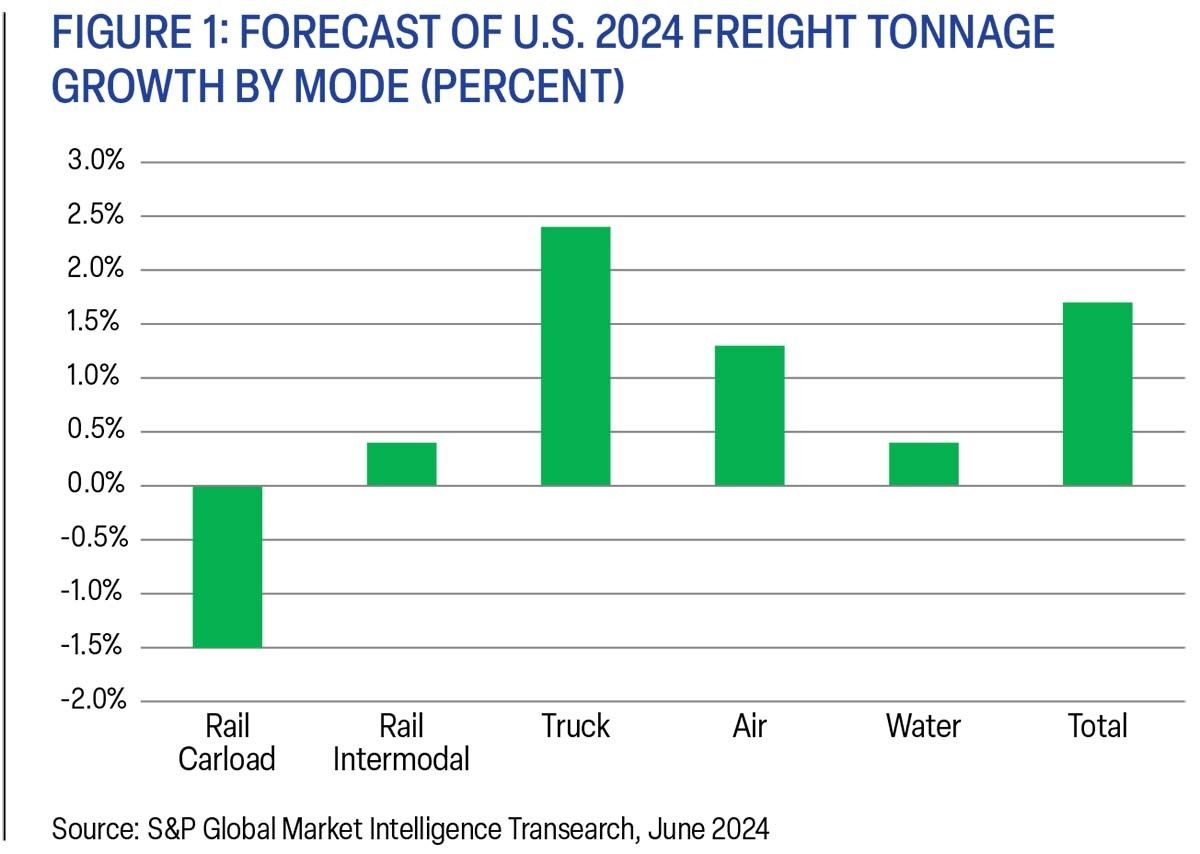
FIGURE 1: Forecast of U.S. 2024 freight tonnage growth by mode (percent)
Carload rail tonnage will suffer from the drop in volumes of the number-one carload volume category of coal. This drop will not be offset by modest growth in manufactured carload commodities, such as chemicals and autos. In contrast, intermodal rail experienced strong growth in the first half of 2024 from growing imports, inventory restocking, the import market share shift back to West Coast container ports, and an early start to peak season. However, intermodal rail tonnage growth for 2024 as a whole will be limited by competitive domestic trucking rates and service times.
The baseline trucking demand forecast is for 2024 tonnage to grow by 2.4%, driven by a 2.6% growth in the substantial private trucking sector. Meanwhile for-hire truckload and less than truckload (LTL) will see more moderate recovery in 2024 volumes.
Air cargo tonnage growth is forecasted at 1.3%, reflecting slowing growth in e-commerce, despite a surge in e-commerce imports in the first half of 2024. The maritime baseline forecast is for a 0.4% growth in tons compared to 2023 levels due to declines in coal tonnage plus concerns with water levels for the Mississippi River system and the Panama Canal.
What this means for shippers
For supply chain managers, the baseline freight forecast implies continued market power, qualified by instances where carrier capacity adjustments and their increased fixed operating costs may limit rate advantages to shippers. There remain threats of temporary operating capacity limitations, such as have been experienced recently at West Coast ports for import rail shippers or from the risk of potential disruption at East and Gulf Coast ports with the expiration of the International Longshoremen's Association (ILA) contracts in September. However, most supply chain managers will see domestic freight carrier performance and rates improve compared with where they were from 2020–2022.
Just 29% of supply chain organizations have the competitive characteristics they’ll need for future readiness, according to a Gartner survey released Tuesday. The survey focused on how organizations are preparing for future challenges and to keep their supply chains competitive.
Gartner surveyed 579 supply chain practitioners to determine the capabilities needed to manage the “future drivers of influence” on supply chains, which include artificial intelligence (AI) achievement and the ability to navigate new trade policies. According to the survey, the five competitive characteristics are: agility, resilience, regionalization, integrated ecosystems, and integrated enterprise strategy.
The survey analysis identified “leaders” among the respondents as supply chain organizations that have already developed at least three of the five competitive characteristics necessary to address the top five drivers of supply chain’s future.
Less than a third have met that threshold.
“Leaders shared a commitment to preparation through long-term, deliberate strategies, while non-leaders were more often focused on short-term priorities,” Pierfrancesco Manenti, vice president analyst in Gartner’s Supply Chain practice, said in a statement announcing the survey results.
“Most leaders have yet to invest in the most advanced technologies (e.g. real-time visibility, digital supply chain twin), but plan to do so in the next three-to-five years,” Manenti also said in the statement. “Leaders see technology as an enabler to their overall business strategies, while non-leaders more often invest in technology first, without having fully established their foundational capabilities.”
As part of the survey, respondents were asked to identify the future drivers of influence on supply chain performance over the next three to five years. The top five drivers are: achievement capability of AI (74%); the amount of new ESG regulations and trade policies being released (67%); geopolitical fight/transition for power (65%); control over data (62%); and talent scarcity (59%).
The analysis also identified four unique profiles of supply chain organizations, based on what their leaders deem as the most crucial capabilities for empowering their organizations over the next three to five years.
First, 54% of retailers are looking for ways to increase their financial recovery from returns. That’s because the cost to return a purchase averages 27% of the purchase price, which erases as much as 50% of the sales margin. But consumers have their own interests in mind: 76% of shoppers admit they’ve embellished or exaggerated the return reason to avoid a fee, a 39% increase from 2023 to 204.
Second, return experiences matter to consumers. A whopping 80% of shoppers stopped shopping at a retailer because of changes to the return policy—a 34% increase YoY.
Third, returns fraud and abuse is top-of-mind-for retailers, with wardrobing rising 38% in 2024. In fact, over two thirds (69%) of shoppers admit to wardrobing, which is the practice of buying an item for a specific reason or event and returning it after use. Shoppers also practice bracketing, or purchasing an item in a variety of colors or sizes and then returning all the unwanted options.
Fourth, returns come with a steep cost in terms of sustainability, with returns amounting to 8.4 billion pounds of landfill waste in 2023 alone.
“As returns have become an integral part of the shopper experience, retailers must balance meeting sky-high expectations with rising costs, environmental impact, and fraudulent behaviors,” Amena Ali, CEO of Optoro, said in the firm’s “2024 Returns Unwrapped” report. “By understanding shoppers’ behaviors and preferences around returns, retailers can create returns experiences that embrace their needs while driving deeper loyalty and protecting their bottom line.”
Facing an evolving supply chain landscape in 2025, companies are being forced to rethink their distribution strategies to cope with challenges like rising cost pressures, persistent labor shortages, and the complexities of managing SKU proliferation.
1. Optimize labor productivity and costs. Forward-thinking businesses are leveraging technology to get more done with fewer resources through approaches like slotting optimization, automation and robotics, and inventory visibility.
2. Maximize capacity with smart solutions. With e-commerce volumes rising, facilities need to handle more SKUs and orders without expanding their physical footprint. That can be achieved through high-density storage and dynamic throughput.
3. Streamline returns management. Returns are a growing challenge, thanks to the continued growth of e-commerce and the consumer practice of bracketing. Businesses can handle that with smarter reverse logistics processes like automated returns processing and reverse logistics visibility.
4. Accelerate order fulfillment with robotics. Robotic solutions are transforming the way orders are fulfilled, helping businesses meet customer expectations faster and more accurately than ever before by using autonomous mobile robots (AMRs and robotic picking.
5. Enhance end-of-line packaging. The final step in the supply chain is often the most visible to customers. So optimizing packaging processes can reduce costs, improve efficiency, and support sustainability goals through automated packaging systems and sustainability initiatives.
That clash has come as retailers have been hustling to adjust to pandemic swings like a renewed focus on e-commerce, then swiftly reimagining store experiences as foot traffic returned. But even as the dust settles from those changes, retailers are now facing renewed questions about how best to define their omnichannel strategy in a world where customers have increasing power and information.
The answer may come from a five-part strategy using integrated components to fortify omnichannel retail, EY said. The approach can unlock value and customer trust through great experiences, but only when implemented cohesively, not individually, EY warns.
The steps include:
1. Functional integration: Is your operating model and data infrastructure siloed between e-commerce and physical stores, or have you developed a cohesive unit centered around delivering seamless customer experience?
2. Customer insights: With consumer centricity at the heart of operations, are you analyzing all touch points to build a holistic view of preferences, behaviors, and buying patterns?
3. Next-generation inventory: Given the right customer insights, how are you utilizing advanced analytics to ensure inventory is optimized to meet demand precisely where and when it’s needed?
4. Distribution partnerships: Having ensured your customers find what they want where they want it, how are your distribution strategies adapting to deliver these choices to them swiftly and efficiently?
5. Real estate strategy: How is your real estate strategy interconnected with insights, inventory and distribution to enhance experience and maximize your footprint?
When approached cohesively, these efforts all build toward one overarching differentiator for retailers: a better customer experience that reaches from brand engagement and order placement through delivery and return, the EY study said. Amid continued volatility and an economy driven by complex customer demands, the retailers best set up to win are those that are striving to gain real-time visibility into stock levels, offer flexible fulfillment options and modernize merchandising through personalized and dynamic customer experiences.
Geopolitical rivalries, alliances, and aspirations are rewiring the global economy—and the imposition of new tariffs on foreign imports by the U.S. will accelerate that process, according to an analysis by Boston Consulting Group (BCG).
Without a broad increase in tariffs, world trade in goods will keep growing at an average of 2.9% annually for the next eight years, the firm forecasts in its report, “Great Powers, Geopolitics, and the Future of Trade.” But the routes goods travel will change markedly as North America reduces its dependence on China and China builds up its links with the Global South, which is cementing its power in the global trade map.
“Global trade is set to top $29 trillion by 2033, but the routes these goods will travel is changing at a remarkable pace,” Aparna Bharadwaj, managing director and partner at BCG, said in a release. “Trade lanes were already shifting from historical patterns and looming US tariffs will accelerate this. Navigating these new dynamics will be critical for any global business.”
To understand those changes, BCG modeled the direct impact of the 60/25/20 scenario (60% tariff on Chinese goods, a 25% on goods from Canada and Mexico, and a 20% on imports from all other countries). The results show that the tariffs would add $640 billion to the cost of importing goods from the top ten U.S. import nations, based on 2023 levels, unless alternative sources or suppliers are found.
In terms of product categories imported by the U.S., the greatest impact would be on imported auto parts and automotive vehicles, which would primarily affect trade with Mexico, the EU, and Japan. Consumer electronics, electrical machinery, and fashion goods would be most affected by higher tariffs on Chinese goods. Specifically, the report forecasts that a 60% tariff rate would add $61 billion to cost of importing consumer electronics products from China into the U.S.