


When you think of markets that have high demand variability and quickchange orders, elevator doors may not be the first that come to mind. But for our company, The Peelle Company Ltd., a make-to-order manufacturer of freight-elevator doors, variation is as much a part of daily business as it is for manufacturers of consumer electronics, semiconductors, or fashion apparel.
In the elevator industry, variation stems from constantly changing building-completion dates caused by bad weather, delayed regulatory approvals, and sequential dependencies between upstream and downstream building processes. As a result, the actual start date of an elevator installation typically is known only weeks beforehand. Elevator installers often must change their requested ship dates at the last moment, shifting variation upstream to equipment manufacturers like Peelle. The custom nature of most elevator products, moreover, creates demand variations that can hinder production throughput.
The Peelle Company's functional organizational structure, coupled with policies that promoted weekly batching and immediate release of orders, introduced congestion and process variation into its production processes. That structure also inhibited production processes from adapting to changing customer ship dates and from effectively managing the variation associated with custommade products. The result was poor-on-time delivery and suboptimized throughput.
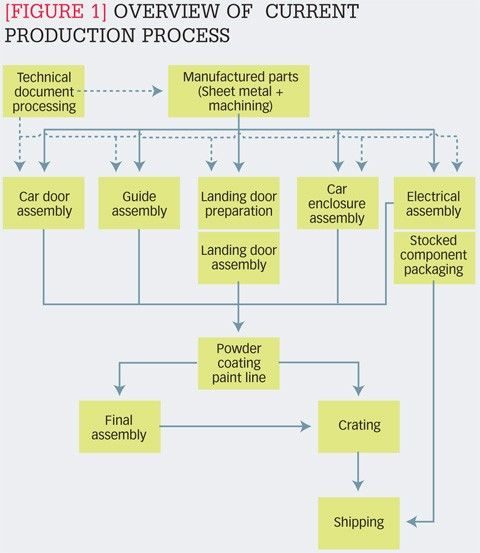
One way we attempted to address those problems was by reorganizing factory production into product-family departments or cells, an arrangement that groups together products that share a common platform or process technology. The reorganization combined 10 individual departments (five that produced components; the four departments assigned to shearing, punching, bending, and welding; and a final landing-door assembly department) into three: one assigned to component parts and sheetsteel processing, another to landing-door preparation, and a third to landing-door assembly.
In the reorganized process, shown in Figure 1, production begins with order-specific technical documents that guide manufacturing and material purchasing. Factory production consists of an upstream manufactured- parts department, four downstream productfamily assembly departments (landing doors, car doors, landing and car door guides, and car enclosures), electrical component assembly, and a stock room.
Another, very effective strategy for resolving those problems was to adopt visual scheduling, which offered a methodology for mitigating the effects of variation on throughput and on-time delivery. Visual scheduling uses three sets of white boards with cards that visually depict orders, along with a set of tools and practices that control the amount of work-in-process, the sequencing of work, and cycle times. At Peelle, this methodology has reduced efficiency-robbing variation and congestion, improved order-status visibility, and resolved conflicting priorities. In the two years following implementation, visual scheduling has not only improved our company's ability to adapt to changing customer ship dates but has also increased on-time delivery rates and raised factory throughput.
The problem: Complexity and variation
A typical order for a freight-elevator door consists of a set of landing doors, one or more car doors, related electrical equipment, and a car enclosure. Peelle designs and manufactures each order to suit a specific building and elevator usage. Freight-elevator landing and car doors have low unit-production volumes and large per-order variation. The company manufactures and ships each order as a single lot.
Peelle's production process was subject to three types of variation that negatively affected production: changes in available productive capacity (capacity variation), changes in demand for that capacity (demand variation), and changes in how often demand is released into the production stream (release-rate variation).
Capacity variation. "Capacity variation" refers to uncertainty in the volume of output a process can deliver over a defined period. At Peelle, capacity variation resulted from per-order differences in three areas: the demand that was imposed on each production department, labor-intensive and skill-dependent production processes, and management policies that encouraged local (within a department) optimization.
The custom nature of The Peelle Company's products can cause capacity variation between upstream and downstream departments and between simultaneous production stages. Different orders require different quantities of landing doors, car doors, and car enclosures as well as differences in size, finish, design, and style. Orders for freight-elevator doors requiring many order-specific and custom-designed parts impose great demand on the upstream manufacturedparts department but not on downstream departments. In contrast, orders with large doors impose a high demand on downstream assembly departments and paint-line capacity, but they have little impact on the manufactured-parts department, electrical assembly, or the stock room.
Our production policies also fostered capacity variation by encouraging each department to optimize its own production processes. For example, production managers organized and released orders for landing doors, car doors, and car enclosures in weekly batches so that departments could optimize the use of specialized machinery, workers' skill sets, and set-up time. To ensure that each department had a steady flow of work lined up, managers often encouraged the early release of technical documents to all departments, regardless of where they were in the production sequence. Finally, in order to meet schedule commitments, production management pushed a full week of new orders into the production stream without regard for the departments' status or existing levels of work-in-process.
Because Peelle's production processes are laborintensive, staffing also had an effect on capacity variation. Staffing levels below the average reduced departmental capacity, which resulted in late completions and a failure to release work when downstream departments needed it. Above-average staffing levels increased departmental capacity, but the resulting above-average output caused work to be released too early to downstream departments. In addition, when a specialist in a particular part or process was absent, local department leaders had no alternative but to defer that work to another day.
Weekly batching, early release of technical documentation, and the constant push of new releases into production permitted department leaders to level local production. Department leaders pushed work backward or pulled it forward to adjust for staffing levels or their departments' productive capacity. Moreover, to maintain level flow, department leaders often bypassed material or information blockages by shifting to the next available order. Although these practices allowed them to optimize local processes and adapt to changes in staffing levels, they also had the negative effect of masking demand imbalances within and between departments.
When an upstream department bypassed work that was needed to meet current demand, and instead produced work before it was needed, it "starved" downstream processes of needed materials while simultaneously overwhelming the downstream department with unneeded inventory. If the required materials failed to arrive, the affected downstream departments completed work to the degree possible, placed the unfinished order into temporary storage, and moved ahead to another order. Meanwhile, early receipt of unneeded materials enabled the downstream department to shift to another order, causing congestion and out-ofsequence production to spill over to the next process. The resulting "desequencing" of upstream and downstream processes increased overall work-in-process, queue length, and waiting time.
This congestion, in turn, created decision-making complexity. At the end of the week, production management had to decide which orders to complete, which personnel to move in order to complete those orders, and which orders to defer to the following week. The result was suboptimized throughput, a constant reworking of the weekly schedule, and "start and stop" production.
Demand variation. "Demand variation" refers to variability of the demand input imposed on a process. Demand variation can manifest across the entire production operation, within a specific process, or between sequentially or simultaneously arranged processes.
At Peelle, demand variation caused by unexpected changes in ship dates created considerable week-toweek variation in production schedules. Production management typically allocated production capacity for elevator door orders eight to 10 weeks prior to shipment. When customers changed their desired ship date, it reduced demand in the originally scheduled week and created a gap in the production schedule. Assigning the order to a new ship date increased demand in that week, which typically already had a full production schedule.
Release-rate variation. Release-rate variation occurs when the pace of orders released into the production stream does not correspond to the pace of production throughput. At Peelle, batch production of technical documents induced release-rate variation. When batching, a technician sequentially created all of the documents that were required for each order. Batch production caused simple orders to move quickly through technical processing, with ample lead time prior to the planned start of production. Complex orders, however, required considerably more time to complete, and thus their release lagged behind the pace of production.
The difference in cycle times between simple and complex orders propagated variation from the technical documentation stage into the factory. When technical staff authorized early production starts by releasing documentation ahead of the pace of production, it introduced more orders into the factory than it could handle. When they released documentation at a pace that was slower than production, it "starved" the factory by delaying the release of needed materials. To prevent that from happening, technical staff often issued partial documents, but that created other problems, fostering "start and stop" production and interdepartmental expediting.
The solution: Visual production scheduling
The Peelle Company's production system clearly was caught up in Hopp and Spearman's "vicious cycle"1 in which —starting from an updated, near-capacity schedule — production relentlessly falls behind forecast, prompting efforts to increase capacity, which is then followed by efforts to reduce demand through ship-date extensions, rescheduling, or order cancellations.
Our plant typically was scheduled at full capacity. However, variation caused the production process to fall behind schedule by an average of one week every three months. The first recourse for getting production back on schedule was to work overtime. But that was not enough. With actual shipping dates falling further behind schedule and customer complaints rising, production management also would recast the schedule by moving orders backward by the number of weeks they were late. Although the revised schedule allowed shipments to go out on time, the vicious cycle would always began anew.
One way we attempted to manage variation and stop the vicious cycle was by implementing visual production scheduling. Visual production scheduling is a methodology that provides a visual display of order status. When combined with product-family cellular production, small-lot sizing, and cross training of personnel, visual scheduling provides the flexibility to adapt to changing customer ship dates without compromising operational performance.
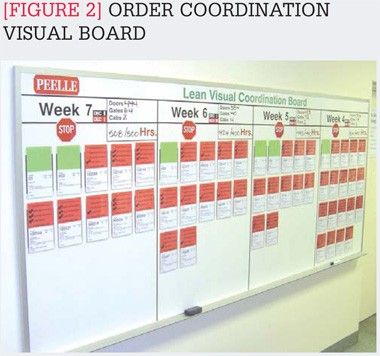
The Peelle Company's visual production schedule consists of wall-mounted white boards that are used to help reduce demand and release-rate variation. Each of the three scheduling boards —order coordination (shown in Figure 2), technical documentation, and production buffer —represents a different stage in the seven-week scheduling process.
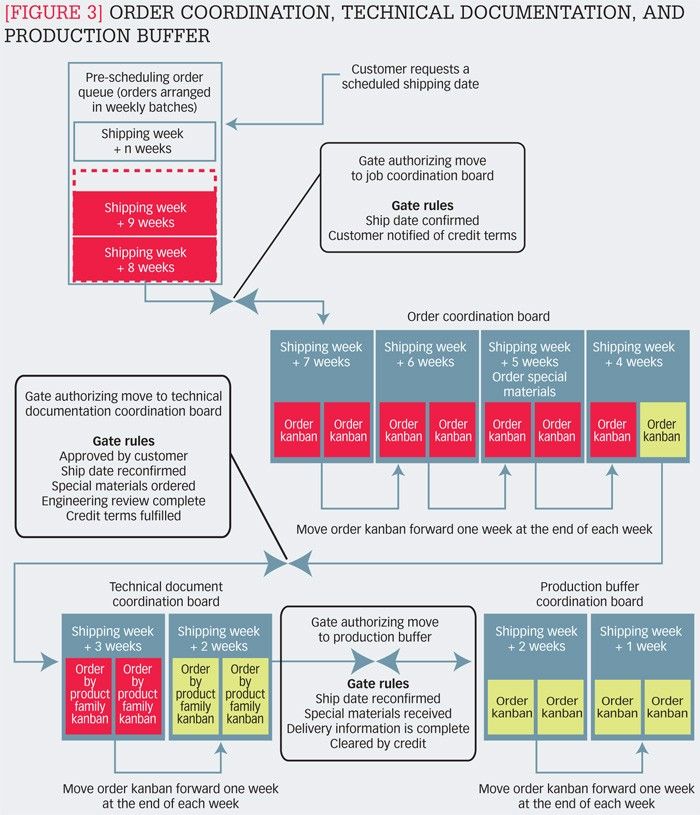
When Peelle receives an order, the order coordinator creates an order kanban (a card containing order information, order status, and criteria for moving through the various production steps) and places it in the weekly "bucket" (capacity grouping) that is aligned with the requested ship date. At the end of each week, the order coordinator pushes each order kanban downstream to the next bucket.
Before an order can move from one board to the next, it must pass through a "gate." A gate is a stoppage point, where work cannot progress until it fulfills a set of criteria authorizing movement. For example, Peelle's orders must first clear two gating criteria ("ship date confirmed" and "customer notified of credit terms") before the order can be moved onto the first board (order coordination) at Week 7.
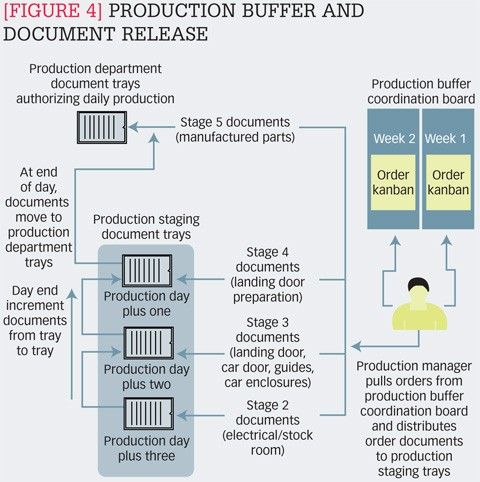
The order-coordination board tracks order status from seven weeks to four weeks prior to shipment. At the end of Week 4, orders must clear another set of gate criteria before moving onto the technical documentation board, which manages the technical documentation process during Week 3 and Week 2. At Week 2, orders that have cleared the required gate can move onto the production-buffer board. The production buffer isolates manufacturing from the variable inflow of orders received from customers. Figures 3 and 4 describe Peelle's visual scheduling process; gating criteria; movement of kanban from weekly bucket to bucket and from board to board; and release of orders into factory production.
At this point, visual scheduling switches its focus from reducing demand and release-rate variation to managing capacity variation. To mitigate capacity variation, we set daily goals for each department. The daily goals synchronize the movement of orders downstream through the production process. They also provide order-status visibility into each product-family department.
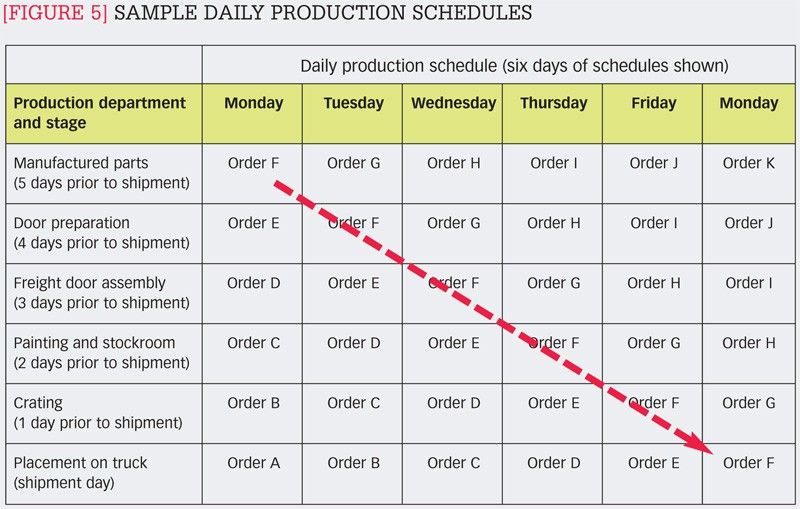
To eliminate the problems caused by weekly leveling within departments, we also implemented daily scheduling and pull-based order release. Daily scheduling imposes a just-in-time release of work to upstream and downstream departments in a predetermined sequence. To maintain a constant level of work-in-process, production management pulls and releases orders daily from the production buffer into factory production at a pace that matches order completions. Each department receives its technical documents on the day it is to start production. Each department then works to complete its assigned daily goal, and then pushes completed work to the next stage. Figure 5 illustrates daily goal assignments and sequencing of product-family departments over a six-day period.
Mitigating effects
The biggest benefit of visual scheduling for The Peelle Company is that it has reduced variation in capacity, demand, and release rates and mitigated the negative effects of these three types of variation.
Mitigating capacity variation. Pooling human resources helped to reduce capacity variation. Resource pooling followed the reorganization of production from many static, function-specific cells into a few dynamic, product-family cells. These cellular departments created a cadre of cross-trained factory staff that can shift from departments with low demand to departments with high demand.
Today, within-department personnel constantly scan the full range of assigned orders, components, and assemblies, and then shift to whichever task is necessary to hit their department's daily goal. When their own daily production goal has been reached, workers move on to other departments that need assistance in meeting their daily goals. There are no function-specific departments constraining total factory throughput, and production management is able to draw on the factory's entire staff to attain production goals.
Daily scheduling has eliminated the downstream starvation that was caused by upstream departments deferring completion of orders. Moreover, daily pull and release of new orders from the production buffer at a pace matching shipments has put a stop to early releases.
Together, daily scheduling and within-department visual indicators have increased the transparency of order status within and between departments. The single-day production schedule aids transparency by limiting the quantity of released demand in each department. The visual status indicators allow production management to quickly evaluate progress toward the completion of daily goals. This increased transparency provides the information needed to level workloads between departments and improve upstream/downstream pacing. Now, production management can quickly identify which departments have excess resources or need more resources. And since visual scheduling only releases new orders at the pace of completions, any work stoppage brings about a visible fall in throughput, making it possible for management to react and institute solutions quickly.
Mitigating demand variation. The gating criteria used in Peelle's visual scheduling system mitigate the effects of last-minute changes in ship dates by preventing orders without confirmed ship dates from entering the production buffer. Starting with the Week 7 gate and then again at the Week 4 and Week 2 gates, the order coordinator confirms the projected shipping date with the customer. With each gate confirmation, the probability of an unanticipated change in the ship date declines.
At each gate, the order coordinator removes and reschedules orders as needed. Because customers can change dates up to two weeks prior to shipment without affecting production flow, the company now can better adapt to their needs. The Week 2 gating criteria also ensure that production does not begin work on orders that lack special materials, technical documentation, shipping information, or credit clearance.
Mitigating release-rate variation. Release-rate variation decreased when we changed the technical documentation process from a batch to a simultaneous method. Cycle time for documentation no longer varies with the complexity of each order. Now, Peelle can speed up production of technical documentation for a complex order by dividing the order into product- family segments and assigning each one to a different engineering technician. Simultaneous production of order documentation also allows the technical staff to match document release to the throughput rate of factory production.
The results: A world of difference
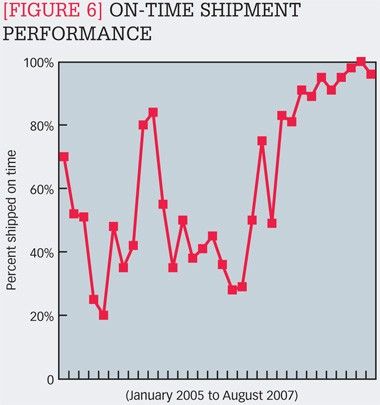
Visual scheduling has allowed The Peelle Company to improve on-time delivery and manufacturing efficiency. Since implementing visual scheduling in June 2006, we have seen a consistent and sustained improvement in on-time delivery. As shown in Figure 6, on-time delivery improved from a long-term mean of about 50 percent to a rate exceeding 95 percent. What's more, customers have reported increased satisfaction because we are much more responsive to their ship-date requirements.
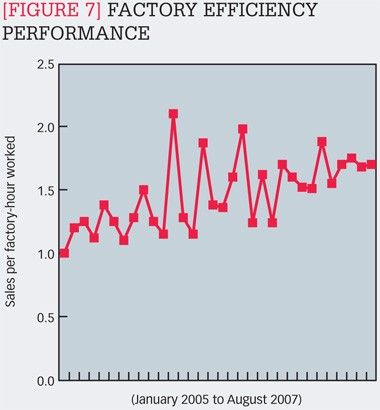
As evidenced in Figure 7, Peelle's manufacturing efficiency (measured as an index of shipments/sales per factory-person hour worked) shows a pattern of improvement both before and after the June 2006 implementation of visual scheduling. Since 2000, Peelle has applied a variety of lean production techniques to improve operational efficiency. Thus, it is difficult to attribute our efficiency gains solely to visual scheduling. Instead, these results suggest that visual scheduling can be an effective part of an overall improvement initiative.
In spite of the many improvements detailed in this article, a few issues remain. When orders create large demand imbalances, new constraints emerge that can prevent a department from achieving its daily goal. Similarly, if we inaccurately estimate the production capacity an order demands, it can lead to daily production goals that are impossible to achieve. And if suppliers fail to deliver needed items when required, departments will miss daily goals.
Our departments are highly dependent on one another. The throughput and completion rate of a single department can affect all downstream departments, causing a system breakdown. Each time an upstream department misses its daily goals, it threatens the ability of those downstream to hit their goals for the next day. Fortunately, visual scheduling allows production management to see such emerging problems and head them off before they affect the next day's work.
Importantly, visual scheduling promotes learning and continuous improvement by making process problems and waste more visible. By imposing daily goals and limitations on work-in-process, creating departmental interdependencies, and reducing cycle times, visual scheduling reveals inefficiencies that otherwise would remain hidden. An important adjunct to visual scheduling, then, is a continuousimprovement process to identify, prioritize, and address specific problems arising out of the failure to attain daily production goals.
Overall, visual scheduling has created a more manageable system. It focuses the staff's attention on tasks that require completion today. Rush orders still exist, but they no longer generate a sense of crisis or create disruption; they simply appear on the next day's schedule. Visual scheduling fosters coordination and pacing between upstream and downstream departments, effectively highlights efficiency-robbing problems, and instigates fast and effective problem solving. It has helped our company improve on-time delivery, increase responsiveness to customers' changing schedules, and reduce the time spent on solving daily crises.
Endnote
1. W.J. Hopp and M.L. Spearman, Factory Physics: Foundation of Manufacturing Management, 2nd edition (Boston: Irwin McGraw-Hill, 2001).


