


"We are in chaos." That was how "Janet," the newly appointed divisional vice president of supply chain for one of my clients, described the business challenges facing her organization. Based on observations from her first four weeks on the job, she believed that her employer, a food manufacturer, was suffering as a result of several major problems affecting the North American division she headed. (At the company's request, we will not use its name or those of its executives in this article.)
Janet's first observation was that while the division formally segmented customers into three categories—key accounts, large national accounts, and everybody else—the supply chain team still treated every customer the same way: as a high priority.
For example, the customer service group spent a lot of time each day prioritizing which customers would get the available inventory. The warehouse then went to great pains to pick, pack, and ship orders as quickly as possible. Finally, the transportation department expedited delivery of the orders. All this for many customers that didn't ask, may not have cared, and certainly did not pay for that level of service. Moreover, despite those painstaking efforts, the division frequently created relationship problems with its largest customers because it blindly gave inventory that the big accounts wanted to a first-time customer that never ordered the product again.
Another observation was that the division had no agreed-upon means of managing its overall supply chain performance. Finance, manufacturing, planning, customer service, logistics, and purchasing all had their own sets of measures and targets. Unit cost, inventory turns, customer service levels, head count, material cost, and forecast accuracy were all managed independently and many times were in competition with one another.
Making matters worse, the division and corporate organizations were not synchronized relative to forecasts and planning. Every month, the division's finance department put together a financial projection at one operational level, the forecasters planned demand at another level, and the inventory planners set up safety stock and storage locations at yet another level. The manufacturing schedulers worked on a different scale, often manufacturing in quantities that were beneficial in terms of unit cost but without considering whether those products were needed by customers. And last, buyer/planners often purchased product based on their objective of reducing the purchase price.
Janet also noted that supply chain processes were informal at best and tended to align with functional silos, including customer service, transportation, inventory planning, forecasting, manufacturing, purchasing, and finance. Senior management seemed to spend more time defending its own turf than protecting the division's market share and profitability.
Moreover, because department leaders did not show knowledge, appreciation, and at times, respect for the supply chain tasks performed prior to and following their own organizations' tasks, there were conflicts over company goals. The decisions about whether to do large or small manufacturing runs were often at odds with inventory targets. Economic order quantities to achieve low purchase prices often undermined shorter lead times that were intended to support greater flexibility. Meanwhile, customer service rules that encouraged expediting frequently conflicted with goals for improving picking and packing efficiency.
Janet's final observation concerned software utilization. The company implemented an enterprise resource planning (ERP) system, but the division used less than half of that system's installed functionality. Different areas of the division turned off or did not use the system, claiming that it impeded continuous improvement and flexibility. Areas such as planning, scheduling, and order entry were hampered by this lack of consistency. There was so much variation, Janet said, that she had counted seven different ways division employees were using the "customer request date" field.
The new vice president of supply chain knew she had to rein in the chaos. To correct the situation, Janet decided, the division needed to establish supply chain process discipline, define and align process ownership, establish common organizational metrics and goals, and deliver benefits to customers and shareholders as quickly as possible.
The SCOR Framework
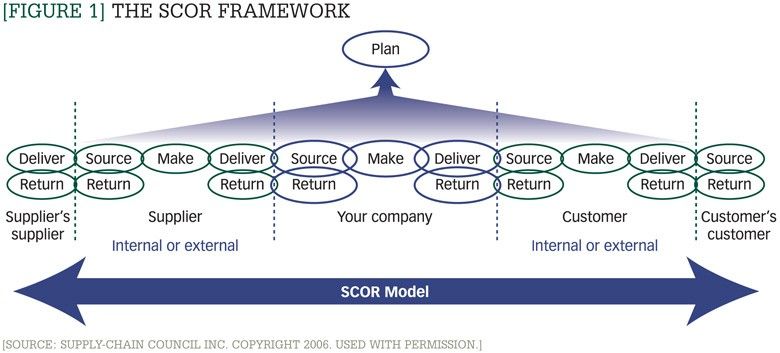
To accomplish those objectives, Janet turned to SCOR, the Supply Chain Operations Reference model, to address the situation. SCOR (a registered mark of the Supply-Chain Council Inc.) combines business process definitions, metrics, technology, and leading practices into a single framework to promote communication among supply chain partners. The model's basic objectives are to describe, measure, and evaluate supply chain configurations by using standard process definitions and metrics, with the goal of supporting continuous improvement and strategic planning. Editor's Note: To get the greatest benefit from this article, readers may find it helpful to learn more about the SCOR model. An overview of the model is available through the Supply-Chain Council's web site.
SCOR includes three levels of process detail: Level 1 defines the scope and content for the SCOR model, Level 2 assesses the type of supply chain configuration, and Level 3 identifies details of process elements, performance attributes, and required systems.
Under the SCOR model, the supply chain is defined as five integrated processes: PLAN, SOURCE, MAKE, DELIVER, and RETURN—from the supplier's supplier to the customer's customer, and all aligned with a company's operational strategy, material, work, and information flows. These relationships are shown in Figure 1.
For all its power and flexibility, however, the SCOR model is still just a series of definitions for processes, metrics, and practices. Simply putting a name to a concept won't save a dime. To turn principle into action, it is necessary to also include effective change management, problem-solving techniques, project management discipline, and business process engineering techniques.
I was brought in as a consultant by Janet to help her company implement the SCOR model. The approach we used followed the six-step Supply Chain Excellence process1, which I believe every company involved in a supply chain project must undertake to achieve success:
- Educate for support
- Discover the opportunity
- Analyze the basis for competition
- Design material flow
- Design work and information flow
- Implement planning and project portfolio development
What follows is a brief overview of the SCOR implementation and the results Janet's division achieved within the Supply Chain Excellence framework.
1. Educate for support
In this case, as with other projects I've worked on, the most important task before getting started was gaining organizational support. To do this, a company must first choose and educate an executive sponsor and a core steering team for the project. Second, it must make sure to understand the project methodology, deliverables, and expected benefits. This background is essential in order for the leadership team to make an informed "go" or "no go" decision. Once the company leadership has decided to move the project forward, the budget, timeline, resources, and project leadership can be assembled and approved.
Janet's executive sponsor was the president of her division. Her core steering team included the corporate chief information officer, the division vice president of manufacturing, the corporate director of global sourcing, general managers for two of her divisional businesses, and the division's chief financial officer. Her project leader was one her divisional materials managers.
For Janet's company, the "go" decision was easy because it offered a proven method, a project cost of US $80,000, and a potential annualized profit improvement of between US $7.5 million and US $15 million (on US $500 million in annual revenues). The sponsor and steering team selected the project team, which included members from four divisional manufacturing plants, the corporate transportation department, and divisional customer departments encompassing customer service, planning, and warehousing.
2. Discover the opportunity
In tackling a project of this scope, it is critically important to define the total number of supply chains served by the company, and then prioritize them based on revenue, inventory level, gross profit, number of stock-keeping units (SKUs), and unit volume. The project team has to be selective, analyzing the smallest number of supply chains that will represent most of the important issues and whose projects can be broadly implemented among the rest. The phrase "think big, act small, and scale fast" is a good way to summarize this approach.
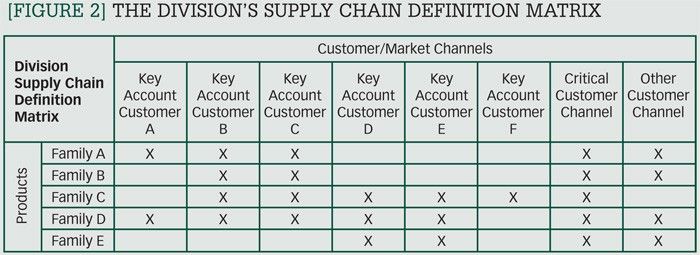
Shortly after getting under way, Janet's project team developed its supply chain definition matrix, shown in Figure 2. Using the corporation's newly defined customer-segmentation strategy and criteria, the team identified eight customer groups: six individual key accounts plus two larger customer channels. Team members used their highest-level product groups to categorize their products. Counting each "X" noted in the definition matrix as an individual supply chain, they defined 26 supply chains within their division. After collecting data for each one, they prioritized the supply chains and concluded that the analytical scope would focus on the five supply chains represented by Products A, C, D, and E for Customers A and E.
3. Analyze the basis for competition
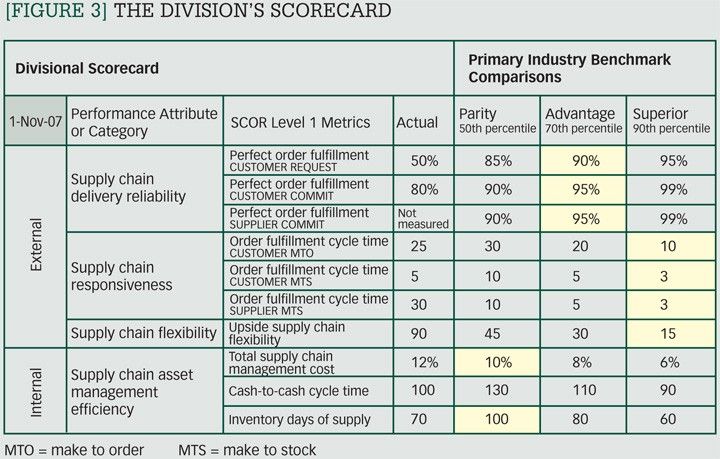
The next step in the SCE process is to use the SCOR metrics scheme to develop a scorecard, which the organization uses to measure project benefits and manage its ongoing supply chain performance. The elements of a scorecard include metrics definitions, actual and benchmark data, and strategic competitive requirements.
The divisional scorecard (Figure 3) was the first time the leadership team had seen all of the key measures on one page. Moreover, many of them hadn't viewed their organizations' performance in comparison with others. The project team used information obtained from the Supply-Chain Council, the Manufacturing Performance Institute, the business research firm Hoover's Inc., and the Warehousing Education and Research Council as sources for the benchmark comparisons.
After digesting the data, the team came to several conclusions. First, even when both customer and company had agreed on a "commit" date for order shipment, the company's performance was below parity—that is, worse than average—and it was far below the competitive target (highlighted in yellow). Second, the division did not have a very good measurement system in place for suppliers' delivery performance. Third, suppliers and the manufacturing plants were not very flexible in response to unplanned demand spikes. And fourth, the total supply chain management cost provided the division with an initial idea of the financial impact of its "one size fits all" cost-to-serve model.
4. Design material flow
The fourth step in the SCE program is to design a more efficient material flow, in particular identifying product movement issues and strategies. There are four commonly used analytical tools in this phase:
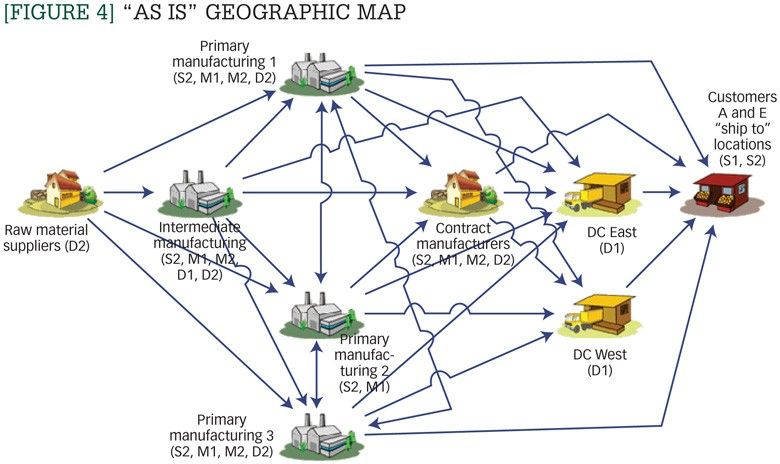
- A map showing the location of the company's plants and distribution centers, as shown in Figure 4.
- The SCOR Level 2 process classification, which characterizes the type of supply chain strategy that a company is using. This is determined based on whether a company makes its product "to stock," "to order," or "engineered."
- A metric defect analysis, which uses data to categorize reasons for poor performance against metrics listed on the scorecard.
- A one-day "brainstorm event," a session in which participants use the defect analysis to devise projects that will solve problems. The brainstorm event also estimates the beneficial effect of each project.
At the conclusion of this phase, a project team has a list of projects aimed at improving the physical material flow as well as a first estimate of the improvement value of each project.
Figure 4 illustrates Janet's division's actual material flow of products A, C, D, and E from suppliers to customer A's and customer E's "ship to" locations. It also includes the SCOR Level 2 process classifications. S1, M1, and D1 indicate that the location is sourcing, making, and delivering stocked product. S2, M2, and D2 indicate that the location is sourcing, making, and delivering to order.
Using the map plus the defect analysis for each scorecard metric, the project team identified six major problems by the end of the brainstorm event. First, the group determined that there was a strategy mismatch between raw material suppliers and all four of the company's manufacturing sites. The suppliers were delivering primarily to order, while the factories were expected to make some products to stock. In fact, the extended lead times identified in the scorecard were causing excess raw material inventory in the plants and hampering the flexibility needed for adjusting to big swings in the forecast.
Second, the quality-assurance cycle time for the product added to lead times; reduced supply chain flexibility for responding to unplanned demand spikes; and increased both warehouse expense and inventory carrying costs in all four manufacturing plants, and in some cases, the four distribution centers. Third, unique product designs were limiting flexibility and therefore the company's ability to use more common and available components. This affected raw material inventory and raw material warehousing expenses. Fourth, storage of commonly used, semi-finished materials and components was not planned or stocked in aggregate because each plant managed its own supply. Fifth, production rejects were contributing to storage issues and problems with slow-moving and obsolete inventory.
5. Design work and information flow
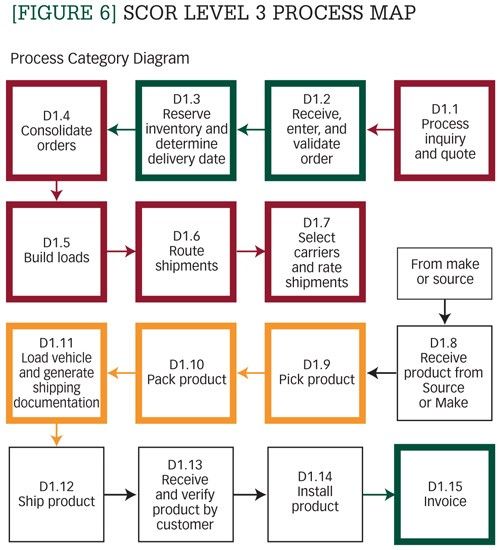
This step of analysis focuses on identifying process and transactional flow issues. There are three commonly used analytical tools in this phase. The first is the so-called "staple yourself to an order" interview. Based on a customer service concept described in a Harvard Business Review article, this method analyzes overall efficiency by following the step-by-step progress of an order. The second tool is the SCOR Level 3 process diagram, which allows the project team to study the process components of a supply chain. A team uses this method to examine how the seemingly disparate processes fit together, noting disconnects, missing steps, and other problems. The third tool is the leading practice assessment. This is an analytical technique that attempts to rate the maturity of a company's supply chain processes using descriptions of minimum standards and leading practices. A team conducts the assessment by comparing the company's own practices to an industry standard, noting gaps and areas for improvement.
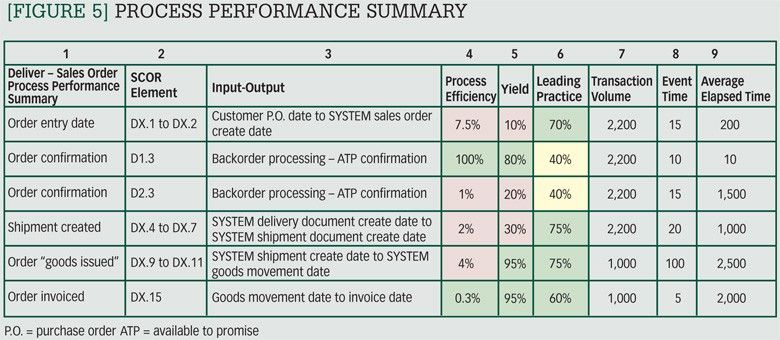
Finally, a team takes these results and compiles an overall process-performance summary. Figure 5 illustrates Janet's team's process-performance summary for analysis of sales orders under the SCOR Deliver processes. The contents of each of the nine columns includes the following:
- ERP system transactions.
- The corresponding SCOR Level 3 elements.
- Events in the system that help measure the elapsed time.
- Process efficiency—the event time (from the eighth column) divided by the average elapsed time (in the ninth column).
- Yield—estimates the percentage of transactions that are perfect, meaning they require no rework.
- The maturity of the process, using a leading-practice-assessment tool. In this case, the team picked the Council of Supply Chain Management's (CSCMP) Supply Chain Management Process Standards for Deliver Processes.2
- Transaction volume—the number of transactions analyzed as part of the data collection.
- Event time—the amount of time required to perform the step, excluding wait time.
- Average elapsed time—the amount of time from the beginning to the end of a task, including wait time.
Using an agreed-upon grading scale, the team determined which processes were ineffective or missing (shown in pink), in need of a focused optimization effort (marked in yellow), or good enough to be left in the continuous improvement category (green). Figure 6 is the corresponding SCOR Level 3 process map for the D1—Deliver Stocked Product strategy. The team assembled similar process-performance summaries and maps for D2—Deliver Make-to-Order Product and for four other major transactions, including forecasts, work orders, purchase orders, and stock-replenishment orders.
The team generated additional observations by looking at the supply chain from a transactional point of view. First, they found that they were using the principles of sales and operations planning (S&OP) to run day-to-day and week-to-week order commitments and consequently didn't address longer-term issues regarding demand and supply balancing. Next, while "available to promise" (ATP) was effective for the D1—Deliver Stocked Product strategy, it did not do a good job of checking availability of and allocating component material for the D2—Deliver Make-to-Order Product strategy. In addition, the team needed to set ATP checking, allocation, and rescheduling rules to support the new customer-segmentation strategy. There also were opportunities to dramatically improve productivity in warehouse operations. Finally, the team agreed that cross-functional planning, scheduling, and manufacturing was absolutely necessary and could no longer be considered optional.
6. Implement planning and project portfolio
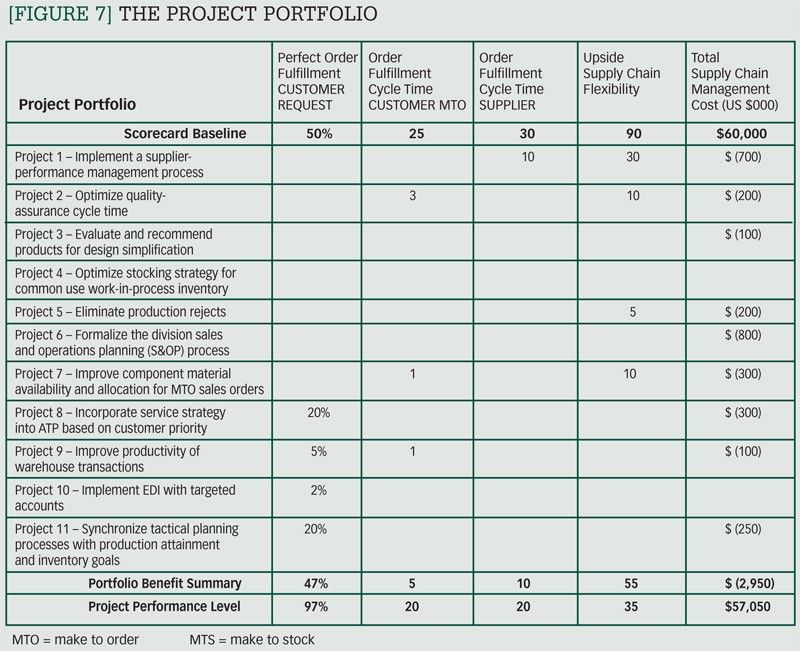
By this time, Janet's team had spent 15 weeks figuring out how to measure supply chain performance, identifying projects that would improve that performance, and estimating the overall benefits of those projects to the business.
The team selected 11 projects to tackle, shown in Figure 7. Among the top priorities were implementing a supplier-performance management process; optimizing quality-assurance cycle times for finished product; and evaluating and recommending opportunities for using standardized materials and components in place of less common ones. Another key project was incorporating a service strategy for ATP based on customer priority. The company also dedicated efforts toward improving the transactional productivity of orders processed in its distribution centers. Other projects included optimizing a stocking strategy, eliminating production rejects, formalizing the division's S&OP process, improving availability of component materials, implementing electronic data interchange (EDI) with targeted accounts, and synchronizing tactical planning processes with production and inventory goals.
In this last phase of the Supply Chain Excellence program, the team needed to assemble implementation resources, timelines, and capital requirements for each of the 11 projects. Each project needed a leader, a design team, a steering team champion, and a system-support team. Janet's group used a ninemonth implementation timeline, in which the first two months were devoted to detailed design and configuration of processes and necessary systems. The next two months focused on process and system pilots, and the following two months focused on process and system refinements and a second round of pilots. The remaining three months were devoted to implementation.
Janet's team used two checklists to guide them through the implementation. The first (Figure 8) related to the effective launch of each project. The second (Figure 9), which Janet developed, addressed how her division's leadership would manage the project portfolio.
The results
One year later, Janet reconvened the project team to reflect on the results and to plan supply chain improvements for the next fiscal year. Although the 11 projects offered the company a clear path for improvement, she said, following that path turned out to be a bumpier road than she had imagined. Some of the project timelines slipped, system enhancements were late, and the leadership team found it more difficult to transition from old functional habits to new, process-oriented ones. Moreover, the financial team had to learn how to manage the benefits of the entire project portfolio rather than judge success or failure on the basis of a single project. And finally, the entire leadership team needed to learn how to manage using the scorecard.
As Figure 10 shows, despite those difficulties, 12 months of hard work paid off. For instance, the division managed to cut US $2.6 million in costs while improving delivery and cycle-time performance. Perfect-order fulfillment improved from 50 percent to 87.5 percent, and the suppliers' order-fulfillment cycle time declined from 30 days to 15 days.
Janet noted that the results met or exceeded targets even though not all of the projects were complete. She also got positive feedback from beyond her division. For example, improved customer confidence in the division's supply chain capability was starting to open new doors for the sales team. And the more customers talked about the value of "total delivered cost," the more the sales team was motivated to understand, support, and even recommend improvements. Moreover, some company executives believe that in the next year of the implementation, supply chain improvements will contribute growth of up to 10 percent in new business, including growth in the share of business with key accounts.
Lastly, Janet described the organizational impact of getting everybody rallied around achieving supply chain excellence. A year earlier, managers were spending their time accusing each other and holding contentious meetings behind closed doors whenever they discovered a supply chain performance problem. Today, the people who work in Janet's company cooperatively measure performance, identify concerns, and resolve problems together.
Endnotes:
1. The author's book, Supply Chain Excellence: A Handbook for Dramatic Improvement Using the SCOR Model, 2nd Edition (AMACOM, 2007), provides more details about the six steps he recommends.
2.Supply Chain Management Process Standards—Deliver is one of a six-part series of guidelines for self-assessing the strengths and weaknesses of current processes, published by the Council of Supply Chain Management Professionals. The standards are available individually or as a complete set at cscmp.org.


