Manufacturing practices differ widely in North America
A recent survey by the Manufacturing Performance Institute and Industry Week found that when it comes to supply chain integration, Mexican plants are ahead of their counterparts in the United States and Canada.
As transportation costs continue to rise, some analysts are saying that Mexico is once again becoming an attractive manufacturing location for serving customers in North America. Those taking another look at Mexico may be interested in the results of an annual survey of nearly 1,000 manufacturers by the Manufacturing Performance Institute and Industry Week magazine.
When it comes to supply chain integration, the survey found that Mexican plants are ahead of their counterparts in the United States and Canada. Some 28 percent of the Mexican plants canvassed said they had extensive integration with suppliers—compared to just 10 percent of U.S. plants and 8 percent of Canadian factories. In addition, 36 percent of Mexican plants reported that they were extensively integrated with their customers, compared to 14 percent of U.S. manufacturers and 16 percent of Canadian manufacturers. One factor accounting for this higher level of integration, according to the study, may be that Mexican plants are more likely to ship product to their own companies' facilities, whereas U.S. and Canadian plants are more likely to ship to other companies. The study did note that U.S. ownership or operation of the Mexican plants contributed in part to these close relationships, although integration was high even among plants with no U.S. affiliation.
Supplier and customer integration is not the only area where Mexican plants led U.S. and Canadian counterparts. Mexican plants also had the highest median inventory turns at 15, compared to 12 for Canadian plants and 8.8 for American manufacturers.
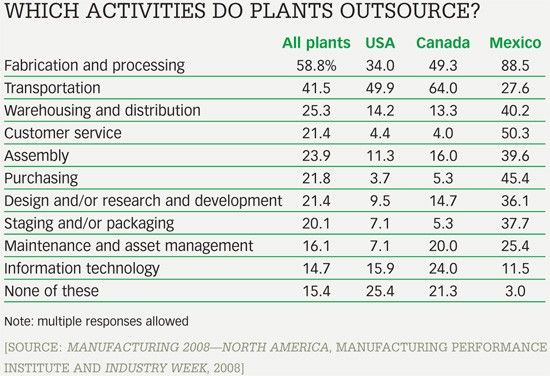
When it comes to operations, Mexican manufacturers outsource many more functions at a much higher rate than do U.S. and Canadian plants. For example, 88.5 percent of Mexican plants surveyed outsource fabrication and processing, compared to 34 percent for U.S. and 49.3 percent for Canadian factories. Some 40 percent of Mexican production facilities used third-party warehousing, compared to about 14 percent in the United States and a little over 13 percent in Canada. Perhaps the greatest difference was in the area of customer service, where 50.3 percent of Mexican plants used outsiders, compared to only 4.4 percent in the United States and 4 percent in Canada. The only functions that were not outsourced at a higher rate in Mexico than in the United States and Canada were transportation and information technology. (See "Which activities do plants outsource?" for details.)
One area in which Mexican manufacturing plants lagged behind their U.S. and Canadian competitors was in cost control. More than half (53 percent) of all respondents reported that manufacturing costs increased over the past year. Despite that hike, a fair number of U.S. plants—40 percent—said that they had managed to reduce their costs. Only 30 percent of Canadian plants and 25 percent of Mexican plants reported cost reductions.
[Source: Manufacturing 2008—North America, Manufacturing Performance Institute and Industry Week, 2008: www.mpi-group.net/thoughtleadership]
Just 29% of supply chain organizations have the competitive characteristics they’ll need for future readiness, according to a Gartner survey released Tuesday. The survey focused on how organizations are preparing for future challenges and to keep their supply chains competitive.
Gartner surveyed 579 supply chain practitioners to determine the capabilities needed to manage the “future drivers of influence” on supply chains, which include artificial intelligence (AI) achievement and the ability to navigate new trade policies. According to the survey, the five competitive characteristics are: agility, resilience, regionalization, integrated ecosystems, and integrated enterprise strategy.
The survey analysis identified “leaders” among the respondents as supply chain organizations that have already developed at least three of the five competitive characteristics necessary to address the top five drivers of supply chain’s future.
Less than a third have met that threshold.
“Leaders shared a commitment to preparation through long-term, deliberate strategies, while non-leaders were more often focused on short-term priorities,” Pierfrancesco Manenti, vice president analyst in Gartner’s Supply Chain practice, said in a statement announcing the survey results.
“Most leaders have yet to invest in the most advanced technologies (e.g. real-time visibility, digital supply chain twin), but plan to do so in the next three-to-five years,” Manenti also said in the statement. “Leaders see technology as an enabler to their overall business strategies, while non-leaders more often invest in technology first, without having fully established their foundational capabilities.”
As part of the survey, respondents were asked to identify the future drivers of influence on supply chain performance over the next three to five years. The top five drivers are: achievement capability of AI (74%); the amount of new ESG regulations and trade policies being released (67%); geopolitical fight/transition for power (65%); control over data (62%); and talent scarcity (59%).
The analysis also identified four unique profiles of supply chain organizations, based on what their leaders deem as the most crucial capabilities for empowering their organizations over the next three to five years.
First, 54% of retailers are looking for ways to increase their financial recovery from returns. That’s because the cost to return a purchase averages 27% of the purchase price, which erases as much as 50% of the sales margin. But consumers have their own interests in mind: 76% of shoppers admit they’ve embellished or exaggerated the return reason to avoid a fee, a 39% increase from 2023 to 204.
Second, return experiences matter to consumers. A whopping 80% of shoppers stopped shopping at a retailer because of changes to the return policy—a 34% increase YoY.
Third, returns fraud and abuse is top-of-mind-for retailers, with wardrobing rising 38% in 2024. In fact, over two thirds (69%) of shoppers admit to wardrobing, which is the practice of buying an item for a specific reason or event and returning it after use. Shoppers also practice bracketing, or purchasing an item in a variety of colors or sizes and then returning all the unwanted options.
Fourth, returns come with a steep cost in terms of sustainability, with returns amounting to 8.4 billion pounds of landfill waste in 2023 alone.
“As returns have become an integral part of the shopper experience, retailers must balance meeting sky-high expectations with rising costs, environmental impact, and fraudulent behaviors,” Amena Ali, CEO of Optoro, said in the firm’s “2024 Returns Unwrapped” report. “By understanding shoppers’ behaviors and preferences around returns, retailers can create returns experiences that embrace their needs while driving deeper loyalty and protecting their bottom line.”
Facing an evolving supply chain landscape in 2025, companies are being forced to rethink their distribution strategies to cope with challenges like rising cost pressures, persistent labor shortages, and the complexities of managing SKU proliferation.
1. Optimize labor productivity and costs. Forward-thinking businesses are leveraging technology to get more done with fewer resources through approaches like slotting optimization, automation and robotics, and inventory visibility.
2. Maximize capacity with smart solutions. With e-commerce volumes rising, facilities need to handle more SKUs and orders without expanding their physical footprint. That can be achieved through high-density storage and dynamic throughput.
3. Streamline returns management. Returns are a growing challenge, thanks to the continued growth of e-commerce and the consumer practice of bracketing. Businesses can handle that with smarter reverse logistics processes like automated returns processing and reverse logistics visibility.
4. Accelerate order fulfillment with robotics. Robotic solutions are transforming the way orders are fulfilled, helping businesses meet customer expectations faster and more accurately than ever before by using autonomous mobile robots (AMRs and robotic picking.
5. Enhance end-of-line packaging. The final step in the supply chain is often the most visible to customers. So optimizing packaging processes can reduce costs, improve efficiency, and support sustainability goals through automated packaging systems and sustainability initiatives.
That clash has come as retailers have been hustling to adjust to pandemic swings like a renewed focus on e-commerce, then swiftly reimagining store experiences as foot traffic returned. But even as the dust settles from those changes, retailers are now facing renewed questions about how best to define their omnichannel strategy in a world where customers have increasing power and information.
The answer may come from a five-part strategy using integrated components to fortify omnichannel retail, EY said. The approach can unlock value and customer trust through great experiences, but only when implemented cohesively, not individually, EY warns.
The steps include:
1. Functional integration: Is your operating model and data infrastructure siloed between e-commerce and physical stores, or have you developed a cohesive unit centered around delivering seamless customer experience?
2. Customer insights: With consumer centricity at the heart of operations, are you analyzing all touch points to build a holistic view of preferences, behaviors, and buying patterns?
3. Next-generation inventory: Given the right customer insights, how are you utilizing advanced analytics to ensure inventory is optimized to meet demand precisely where and when it’s needed?
4. Distribution partnerships: Having ensured your customers find what they want where they want it, how are your distribution strategies adapting to deliver these choices to them swiftly and efficiently?
5. Real estate strategy: How is your real estate strategy interconnected with insights, inventory and distribution to enhance experience and maximize your footprint?
When approached cohesively, these efforts all build toward one overarching differentiator for retailers: a better customer experience that reaches from brand engagement and order placement through delivery and return, the EY study said. Amid continued volatility and an economy driven by complex customer demands, the retailers best set up to win are those that are striving to gain real-time visibility into stock levels, offer flexible fulfillment options and modernize merchandising through personalized and dynamic customer experiences.
Geopolitical rivalries, alliances, and aspirations are rewiring the global economy—and the imposition of new tariffs on foreign imports by the U.S. will accelerate that process, according to an analysis by Boston Consulting Group (BCG).
Without a broad increase in tariffs, world trade in goods will keep growing at an average of 2.9% annually for the next eight years, the firm forecasts in its report, “Great Powers, Geopolitics, and the Future of Trade.” But the routes goods travel will change markedly as North America reduces its dependence on China and China builds up its links with the Global South, which is cementing its power in the global trade map.
“Global trade is set to top $29 trillion by 2033, but the routes these goods will travel is changing at a remarkable pace,” Aparna Bharadwaj, managing director and partner at BCG, said in a release. “Trade lanes were already shifting from historical patterns and looming US tariffs will accelerate this. Navigating these new dynamics will be critical for any global business.”
To understand those changes, BCG modeled the direct impact of the 60/25/20 scenario (60% tariff on Chinese goods, a 25% on goods from Canada and Mexico, and a 20% on imports from all other countries). The results show that the tariffs would add $640 billion to the cost of importing goods from the top ten U.S. import nations, based on 2023 levels, unless alternative sources or suppliers are found.
In terms of product categories imported by the U.S., the greatest impact would be on imported auto parts and automotive vehicles, which would primarily affect trade with Mexico, the EU, and Japan. Consumer electronics, electrical machinery, and fashion goods would be most affected by higher tariffs on Chinese goods. Specifically, the report forecasts that a 60% tariff rate would add $61 billion to cost of importing consumer electronics products from China into the U.S.