


Consider: In 2016, the area around Baton Rouge, Louisiana, was devastated by a thousand-year flood that the governor described as "historic." In 2017, Hurricane Harvey caused unprecedented flooding in Eastern Texas, displacing more than 30,000 people. In 2018, Hurricane Florence brought record-breaking rainfall and flooding to many parts of North Carolina.
Data suggest that catastrophic events are on the rise. According to the insurance company Munich Re1, over the last 30 years there have been an average of 500 "catastrophic events"2 per year worldwide. The annual average for the last decade has risen to 650. In 2018 alone, there were 850 catastrophic events.
These events have had a significant impact on business. According to an international survey conducted by Zurich Insurance and the Business Continuity Institute during 2018-2019 more than 50 percent of firms experienced "significant disruption" of their supply chains.3 This survey found the five most common sources of supply chain disruption during this period were:
- Unplanned information technology (IT) or telecommunications outages: 44.1%
- Adverse weather: 35.1%
- Cyber attack and data breach: 26.1%
- Loss of talent/skills: 21.2%
- Transport network disruption: 15.8%
Whatever the source or expression of these significant disruptions, they share a common effect: All of them generated unplanned bottlenecks in demand and/or supply networks. According to a recent report by the National Academies of Sciences, Engineering, and Medicine, a bottleneck is "any point in a supply chain that limits its flow."4 Especially when disruption involves a hard hit to a "planned bottleneck"—such as a manufacturing facility, distribution center, or major transportation route—the consequences can quickly cascade toward catastrophe.
Supply chain professionals are used to dealing with disruptions and bottlenecks. In "hurricane country," they plan and build inventory for hurricane season the same way that they build up inventory for peak holiday shopping season. (Individual picks may be different, but the operational tempo is similar.)
Catastrophes, however, are different. Moving groceries into or medical goods out of post-Hurricane Maria Puerto Rico was beyond the experience of most supply chain professionals.5 Likewise, supply chain professionals could not draw from any prior experience to help them re-establish flow for 5% of the global fuel supply after a drone attack damaged some of Saudi Arabia's biggest oil plants.6 When more than 80% of a pre-existing channel—whether it be maritime, surface, air, or financial—is lost, it is urgently, profoundly survival-challenging.
In most disaster contexts (such as blizzards and storms), supply chain owners and operators are typically impatient for the public sector to get out of the way so that the flow of goods and services can resume. But in catastrophes,} the private-sector supply chain often needs the active assistance of the public sector to clear the way, ensure refueling, provide security, share information, and collaborate in dozens of other ways to facilitate the recovery of flow. That's because disasters disrupt, but catastrophes destroy. Networks recover from disasters. Catastrophes require new networks to emerge.
Given that catastrophes, by their very nature, are untypical, how can supply chains be made resilient to them? Can supply chains respond to worst cases in a manner that will avoid catastrophic outcomes?
These are questions that the U.S. Department of Homeland Security's National Risk Management Center asked CNA's Institute for Public Research to investigate. CNA is a not-for-profit research and analysis organization located in Arlington, Virginia, that works with public-sector organizations in the areas of national security, homeland security, and emergency management. CNA was charged with developing a systemic and scalable strategy that would minimize the effect of a catastrophe on a population.
Preparing for the worst
When a catastrophe destroys pre-existing networks of demand and supply, how can millions of survivors be effectively served? When the electrical grid is gone, telecommunications are cut, and bridges—both physical and financial—have been severed, is it even possible to restitch the critical connections?
"Unless a way is found to quickly and effectively re-establish prior network capacity [after a catastrophe], hundreds of thousands will lose access to life-saving commodities," David Kaufman, CNA's vice president for safety and security,explains. "We needed to find a way that was data-driven and reflective of the supply chain's full reality. Supply chains involve engineered systems, but even more, they are human networks with all the complexity that implies."
So, CNA needed to develop a methodology for preparing for a catastrophe that would help the affected area understand the relationships involved. "Contemporary demand and supply networks are complex adaptive systems," Delilah Barton, the CNA project manager, notes. "This complexity emerges from observable node-and-link relationships. By focusing on these relationships, we have a much better chance of anticipating shock, stress, resilience—and operational options—across the network."
A fundamental part of understanding these relationships, according to Kaufman and his colleagues, is understanding the flow—as in the flow of goods, services, and money—that occurs between these nodes and links. "Dense urban populations, modern economies, modern life depend on flow. Not just infrastructure, but what is flowing through that infrastructure," Kaufman emphasizes.
The flow of water, food, and fuel is where CNA started. Keep these flowing, and there will be opportunity to address other flows and other impediments later. If flows of water, food, and fuel fail, other flows are probably superfluous.
In contemporary supply chains, flow is facilitated by the placement and behavior of distribution centers, cross docks, micro fulfillment centers, and other "planned bottlenecks," or places where flow is purposefully concentrated, often to increase the network's speed and ability to make targeted deliveries.
"Concentration is one of the most obvious characteristics of supply chains, especially those serving dense urban areas,"Lars Hanson, the project's lead scientist, explains. "Individual commodities are usually concentrated in distribution centers and recurring freight channels. Similar nodes are often very proximate to each other and to related clusters of transportation links, fuel services, truckers, and facilities serving truckers."
It is important to note that bottlenecks, or points of concentration, are not binary: they are neither good nor bad, on or off. Whether the concentration is considered an optimized flow or a disruptive congestion is usually an issue of velocity rather than volume. Concentration of volume can constrain or amplify flow, depending on how network functions and capacity facilitate throughput. Production facilities, distribution centers, retail locations, and all other planned bottlenecks are potentially helpful or problematic depending on how well demand is calibrated with supply.
CNA's strategy and system for dealing with catastrophes needed to start, then, where most supply chain professionals start when they are trying to optimize a system: Where is the bottleneck? Is it a planned bottleneck operating at capacity? Or is it an unplanned bottleneck operating at reduced capacity? Once the bottleneck(s) has been identified, you can work to improve the overall system by asking: "How can we take measures to 'exploit' the bottleneck?"7
Supply Chain Operational Engagement (SCOPE)
The CNA team hypothesized that a valid mapping of high-proportion flows between concentrations would support post-catastrophe problem-identification and problem-solving. The resulting characterizations of how the supply chain operates under ordinary conditions should help organizations anticipate how hazards could potentially disrupt flow and, thereby, facilitate mitigation and response.
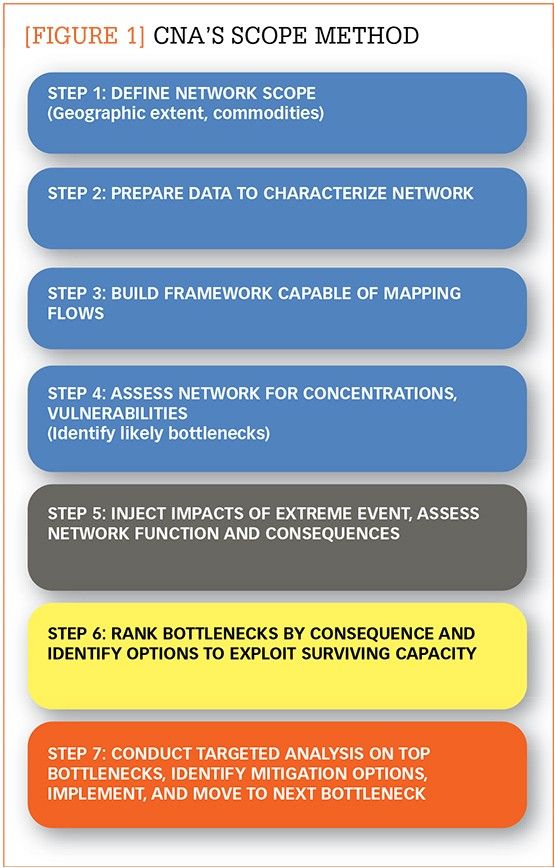
CNA developed a seven-step Supply Chain Operational Engagement (SCOPE) Method (see Figure 1) and pilot tested it in the Puget Sound (Seattle metro) region in the state of Washington during 2019. The SCOPE method was validated in private-public workshops during August and September 2019. The method was also deployed to support the U.S. Federal Emergency Management Agency (FEMA) Supply Chain Analysis Network (SCAN) for disaster response operations during Tropical Storm Flossie and Hurricane Dorian.
Step 1: Scope the network
The first step involves choosing your place and flows because "every disaster is local" and each demand and supply network is different. Given the purposes of SCOPE, water, food, and fuel will usually be toward the top of the list for analysis. But other "content flows" may be especially important given the specific characteristics of the place and/or the threats to the place. For example, in 2017 it was discovered that outbound flows of medical goods from Puerto Rico were very important to fundamental aspects of clinical care across the United States. SCOPE also works to identify these less-typical flows.
Supply chain resilience is especially important in the case of dense populations where there is no external capacity to replace the pre-existing flow. SCOPE focuses on understanding the character and expression of flow in specific places with populations greater than a half-million people. Over the half-million threshold, there is often no effective near-term back-up. At higher multiples of the threshold, there are no relief or disaster response organizations with enough capacity to quickly supply the area.
Step 2: Prepare data
With place and specific flows chosen, the SCOPE method gives attention to finding four different kinds of concentration within these flows and that place.
- Source concentrations: Where are the principal places that locally consumed products are manufactured or processed? What proportion is sourced locally? Where are the principal sources outside the local region? Are there clear places of disproportionate concentration inside or outside the region?
- Push concentrations: From what locations are locally consumed products principally distributed? What proportion of local consumption originates from each of these locations? Are there other points of push concentration upstream that are as essential to volume and/or velocity of flow?
- Link concentrations: What transportation modalities and routes are used to transport products from sources of supply to sources of demand?
- Pull concentrations: Where is the population concentrated within the geography? Where is wealth concentrated within the geography? Where are retail outlets located? Where are SNAP (Supplemental Nutrition Assistance Program) certified retailers located? Where are SNAP beneficiaries concentrated?
There are likely to be different sources of data that can be used to identify these concentrations depending on the place and flows chosen. Some open sources of nationally aggregated data include:
- United States Census Bureau (https://www.census.gov/data.html) for population and demographic information.
- Commodity Flow Survey (https://www.census.gov/programs-surveys/cfs.html) for information on demand for transportation facilities and services, energy use, safety risk, and environmental concerns.
- Homeland Infrastructure Foundation Level Data (https://hifld-geoplatform.opendata.arcgis.com) for geospatial data on such categories as energy services, emergency services, communications infrastructure, ground transportation infrastructure, and more.
- FEWSION (https://fewsion.us) for mapping of the U.S. food, energy, and water system.
- PolicyMap (https://www.policymap.com) for online mapping with data on demographics, real estate, health, jobs, and more.
State and local regulatory and taxing bodies are also rich sources of data that can expose details, connections, and flows not captured in wider-area data streams.
SCOPE tends to depend on data streams that display longer-term results. Annual sales data, monthly volume data, annual average daily truck traffic, and similar measures provide decision makers with a sense of how capacity emerges and plays out over a wide area. There can be considerable variability in daily and seasonal flow patterns in a supply chain. But in the aftermath of an extreme event—especially a catastrophic event—decision makers will usually be most concerned with discerning what proportion of overall capacity has survived or has been lost. SCOPE seeks to create an integrative—even synthesizing—"ecosystem view" of demand and supply networks.
These flow concentrations are then reviewed in relationship to their infrastructure dependencies: especially grid power, telecommunications, and major flow channels originating from outside the envelope selected in Step 1 (for example, maritime routes or long-distance truck routes). Where is there innate vulnerability? Where is there demonstrated resilience? If one or more of these dependencies become disconnected from the flow concentrations, what is the likely impact on continuing flow? What is the likely impact on flow capacity?
The Puget Sound pilot used the Microsoft Building Footprint database8 as a quick way of identifying the location of distribution center corridors in the area. It also used information on licensed food processors and food warehouses available from the Washington State Department of Agriculture. State and federal data sources were able to show where most holders of Commercial Drivers Licenses lived.
In the Puget Sound pilot, significant supply concentrations were identified in the Tacoma area and in the Kent Valley. These concentrations surprised many public-sector officials. Even some private-sector players admitted the maps helped them recognize risks that had emerged so gradually as to be taken for granted.
Step 3: Produce flow maps
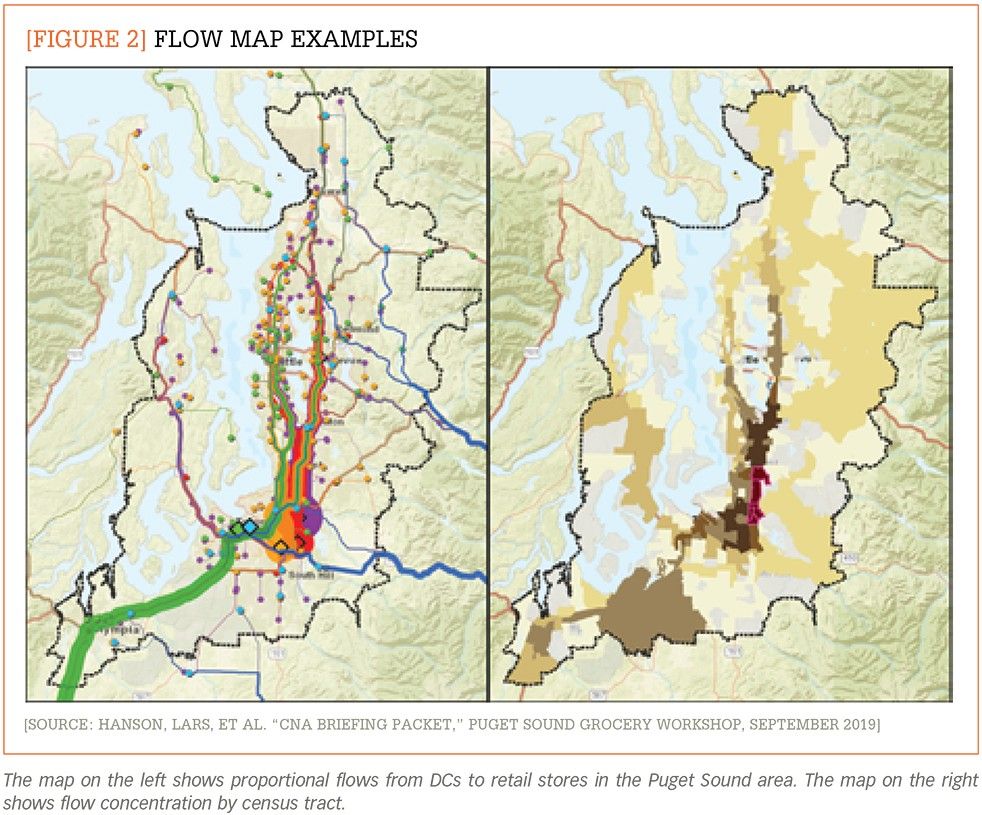
The data accessed in Step 2 identify where flows are concentrated and where flows move into and within the target geography. Locating these nodes and links on a map (and surrounding area as appropriate) gives decision makers an intuitive sense of key relationships. Estimating and displaying high proportional flows between nodes and across these links enhance the ability of decision makers and other responders to anticipate the disruption of flows and potential response and mitigation measures. (Figure 2 shows two examples of flow maps created for the Puget Sound pilot.)
The resulting flow maps reveal potential bottlenecks, both planned and unplanned. In contemporary demand and supply networks, "planned bottlenecks" are places and/or functions that typically concentrate flow to facilitate enhanced velocity of supply. Distribution hubs are premier examples. Such concentrations of flow are also often associated with the physical concentration of functions and services (for example fueling, truck maintenance, intermodal transfer, and more).
The emergence of "unplanned bottlenecks," such as trucking route congestion or a production backup, is a constant feature of demand and supply networks. Early identification and intervention to decongest unplanned bottlenecks is a core capability of most enterprises' supply chain management teams. But in the aftermath of a wide-area extreme event, the number and nature of bottlenecks are likely to exceed existing enterprise-specific capabilities. A network-wide collaborative effort to address shared bottlenecks should accelerate both enterprise and network resilience.
Step 4: Initial assessment of data-derived network
The method's first three steps identify the problem scope, gather data, and then generate maps and other data-driven descriptions of demand and supply networks. By identifying pre-existing planned bottlenecks, SCOPE can help network stakeholders—private and public—envision and work through mitigation and response issues to enhance resilience. But data seldom reflect the full reality. This is especially an issue when data streams originally conceived for one purpose are utilized as proxy indicators for another purpose. Depending on how, when, and what data are gathered, even accurate data can support reasonable but skewed interpretations. As a result, a fundamental part of SCOPE is the active participation of key supply chain operators and owners.
The Puget Sound pilot, conducted in collaboration with emergency managers in the region and the American Logistics Aid Network (ALAN), solicited anecdotal information through discussions with grocery and related stakeholders during a private-public workshop hosted on August 7, 2019, and a follow-on workshop on September 12, 2019. Flow maps and other network characterizations were presented. Expert insiders were asked if the structure and flow presented conformed with their personal experience of the grocery sector in the Puget Sound region.
During the August 7 workshop, grocery stakeholders affirmed the accuracy of maps and related findings regarding push concentrations, link concentrations, and pull concentrations. The stakeholders confirmed that the origins, channels, and proportions shown in the maps and network characterizations reflected their own sense of reality, and suggested follow-on research related to source concentrations.
The method, its data sources, and maps provide private and public stakeholders with a helpful new tool for disaster preparedness, mitigation, and response. SCOPE's systematic involvement of stakeholders in screening outcomes has been helpful in cultivating practical—and potentially sustainable—collaboration between private sector competitors and between the private and public sectors.
Step 5: Inject projected impact of extreme event
Once stakeholders have a sense of how the ecosystem of demand and supply works under ordinary circumstances, they can begin to think about how an extreme event might affect that ecosystem. The ultimate outcome of Step 5 is to identify pre-existing planned bottlenecks that are judged to be most likely to survive the extreme events projected.
At the close of the August 7 workshop, the impacts of three seismic events were projected on the Puget Sound demand and supply ecosystem. The September 12 workshop focused on mitigating these impacts and restoring the volume and velocity of grocery flows. Discussion during the workshops revealed considerable differences between private-sector and public-sector concepts of the key functions involved in high-volume, high-velocity demand and supply networks. These differences were not resolved during the September 12 workshop, but post-workshop surveys found that participants were motivated to remain in discussion to identify and leverage effective sources of grocery volume and velocity in the aftermath of a catastrophic event. Local emergency management agencies intend to continue with Step 5 in 2020.
Step 6: Rank potential bottlenecks
Of the planned bottlenecks most likely to survive the catastrophe, which offer the greatest capacity to exploit for post-event recovery? Which could provide the volume of supply needed at the greatest velocity? Where can flow be best decongested? Where can flow be most quickly and thoroughly resumed and even surged? Initial ranking can be undertaken using data-derived methods and vetted with stakeholders to confirm, clarify, or deny.
Step 7: Analyze top bottlenecks
The completion of Step 6 restores bottleneck analysis to a specific node or link, consistent with the traditional facility focus of most supply chain management organizations. Depending on the place—such as a grocery distribution center, fuel rack, water pumping station, or other planned bottleneck—there are many expert methods and tools that can be deployed to conduct an analysis of facility-specific functions, throughputs, bottlenecks, and flow. These are in regular use across most contemporary supply chains.
Facility-specific bottleneck analysis is typically based on reasonable predictions of demand and supply in an ordinary operating environment. Step 7's focus, however, is on how "black-sky events"—such as long-term grid loss, disruption of telecommunications, and destruction of roadways—can be anticipated. How can these and other impacts be mitigated in advance or in response? How can the surviving capacity of the node or link be maximized under extreme duress? What can private and public stakeholders do over time to ensure that these mitigation measures are in place when needed?
The important role of the private sector
The seven-step Supply Chain Operational Engagement (SCOPE) method delivers pertinent data on demand and supply networks to private and public decision makers. Using this method, private-sector organizations can work with their supply chain partners, competitors, and the public sector to mitigate supply chain risks and enhance supply chain resilience.
This shared effort is data-informed yet does not require companies to provide proprietary data or undergo cumbersome aggregation and anonymization of nonpublic data. With careful and creative analysis of widely available open source data, the public sector generates a strategic view of crucial flows, dependencies, and risks relevant to serving dense populations.
SCOPE will be further tested and refined in 2020. Early adopters are in discussion with CNA, and roll out to a wider audience is anticipated. Participating in this process provides private-sector players insight into wide-area, long-term threats that otherwise seldom receive serious operational attention. By working together to identify, mitigate, and exploit strategic bottlenecks, both private- and public-sector organizations will build collaborative skills that should pay important dividends in an actual catastrophic event.
Editor's Note: Philip J. Palin has served as the principal investigator for Supply Chain Resilience with the Institute for Public Research of the not-for-profit CNA Corporation and with the Resilient America Roundtable of the National Academies of Sciences, Engineering, and Medicine.
Notes:
1. Petra Löw, "The Natural Disasters of 2018 in Figures," Munich Re, August 1, 2019, https://www.munichre.com/topics-online/en/climate-change-and-natural-disasters/natural-disasters/the-natural-disasters-of-2018-in-figures.html
2. The insurance industry has long defined a "catastrophe loss" as a low-frequency, high consequence, often wide-area event that falls outside ordinary actuarial projections. Until recently a catastrophe was defined as having "devastating effect" and random cause. Given the increasing frequency of such events, the insurance industry is currently developing Catastrophic Loss Indexes and related methods in an attempt to manage financial exposure to catastrophic consequences.
3. Rachael Elliott, Catherine Thomas, and Kamal Muhammad, Supply Chain Resilience Report, Business Continuity Institute and Zurich Insurance Company Ltd., 2019: https://insider.zurich.co.uk/app/uploads/2019/11/BCISupplyChainResilienceReportOctober2019SingleLow1.pdf
4.. Strengthening Post-Hurricane Supply Chain Resilience, The National Academies of Science, Engineering, and Medicine, 2020, https://www.nap.edu/catalog/25490/strengthening-post-hurricane-supply-chain-resilience-observations-from-hurricanes-harvey
5. Philip J. Palin, Lars S. Hanson, Delilah Barton, and Ashley Frohwein, "Retail Resilience in Puerto Rico," Supply Chain Resilience and the 2017 Hurricane Season, CNA, October 2018.
6. See the report on "Saudi Oil Attacks," S&P Global, September 16, 2019, https://www.spglobal.com/en/research-insights/featured/saudi-oil-attacks
7. In The Theory of Constraints by Eliyahu Goldratt, to "exploit" a constraint or bottleneck involves eliminating any work that does not contribute to the goal and/or subordinating other supply chain components to the limitations of the bottleneck and/or "elevating" throughput at the bottleneck.
8. https://www.arcgis.com/home/item.html?id=f40326b0dea54330ae39584012807126

David Kaufman
Communities interested in using the CNA Supply Chain Operational Engagement (CNA SCOPE) method can contact David Kaufman, vice president for safety and security with CNA's Institute for Public Research. (kaufmand@cna.org or (703) 824-2080). Here Kaufman answers some frequently asked questions.
Q: Is SCOPE appropriate for any community?
Yes, but it is probably most helpful to communities with dense populations of greater than 500,000. It is especially helpful to these communities if they are a considerable distance from other population centers and are otherwise engaged in preparing for a catastrophic risk.
Q: Is SCOPE appropriate for any commodity?
The Puget Sound pilot confirmed that SCOPE is appropriate for public water, grocery, and refined fuels. The flows and functions of most other commodities strike us as analogous, but so far we have only tested and confirmed these three.
Q: Does SCOPE require any particular technology?
No, SCOPE is an analytical method that supports decision-making, not a technology. The process can be integrated with a wide array of decision-support technologies.
Q: Does SCOPE require access to proprietary databases?
No, we have purposefully developed and tested SCOPE using open sources. Other data sources could also be used and could deliver even finer fidelity. But the Puget Sound pilot confirmed that open sources can provide what is needed for an accurate and helpful strategic view of wide-area—perhaps market-area—demand and supply ecosystems.
Q: How much does it cost to deploy SCOPE?
So far, we have only tested SCOPE in the Puget Sound pilot. Now that SCOPE has been validated, we are confident in our ability to deploy the method to other regions and other commodities. As a not-for-profit organization, CNA is dedicated to advancing the public good. We would welco


