


While it's good to know where you've been, it's just as important to know where you are now and where you're going. It was this belief that led us to develop the Logistics Managers Index (LMI) four years ago. We believed that the logistics industry can provide an indicator of where the economy as a whole is heading.
When we read about the economy in business newspapers or magazines or hear about it on the radio or TV, we usually see it discussed in terms of gross domestic product (GDP). GDP is certainly the most popular method of measuring an economy's output and is usually considered an indicator of the size of an economy.
But while GDP does a good job of calculating the total value of final goods and services produced within a specific country, it has its limitations. With GDP, the emphasis is on the word "final." It measures the economic activity in the last mile or the final stage in the supply chain as it makes its way to the consumer. As a result, GDP misses the upstream activities by only measuring once right at the end of the supply chain. This underestimates the size of the activities in a supply chain or an economy.
GDP only tells what already happened in an economy, it does not give much information about what is currently happening or is likely to happen in the future. It is a lagging indicator and not a leading indicator.
To fully understand what is happening and what is likely to happen within an economy, upstream activity needs to be measured. These measures do not necessarily have to replace metrics such as GDP, but they are needed to get a full picture of current and future trends.
The Logistics Managers Index is an attempt to measure important elements of the economy throughout the supply chain in the United States. Researchers have found that inventories, transportation capacity and prices, and warehousing are elements of the economy that are found at every step in the supply chain. By looking at changes in these economic components, we can better see what is currently happening and what is likely to happen in the near future.
The LMI is a monthly cooperative research venture between several supply chain management universities and the Council of Supply Chain Management Professionals (CSCMP). We collect data directly from logistics and supply chain executives having to do with trends in warehousing, transportation, and inventory across a wide spectrum of industries. The Logistics Managers' Index consists of eight metrics as well as an overall index score. When interpreting our results, any value above 50.0 indicates growth, and any value below 50.0 indicates contraction. Put simply, higher numbers=more growth, and lower numbers=more contraction.
A time of uncertainty
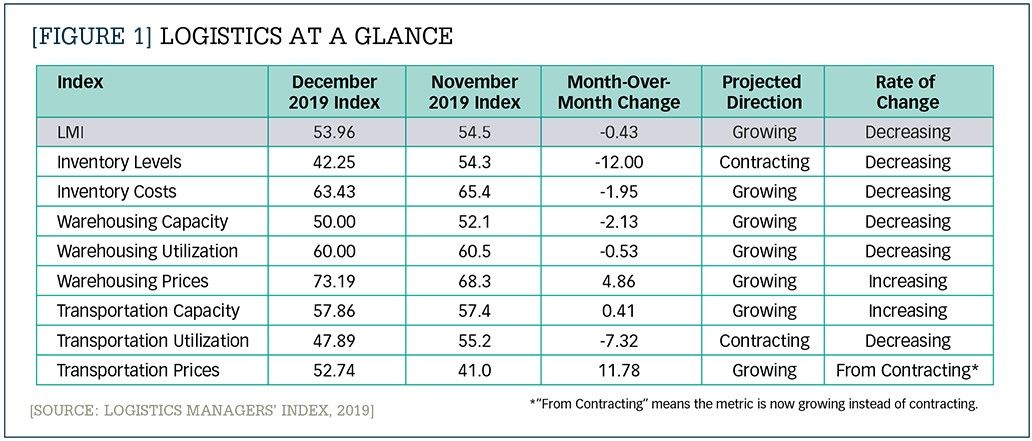
The table in Figure 1 shows the December 2019 scores for each of the eight components of the Logistics Managers' Index (as well as the overall index score) and compares them to the numbers for November 2019.1 As you can see, six of the eight metrics show signs of growth, but many of them are moving at lower or considerably decreased rates.
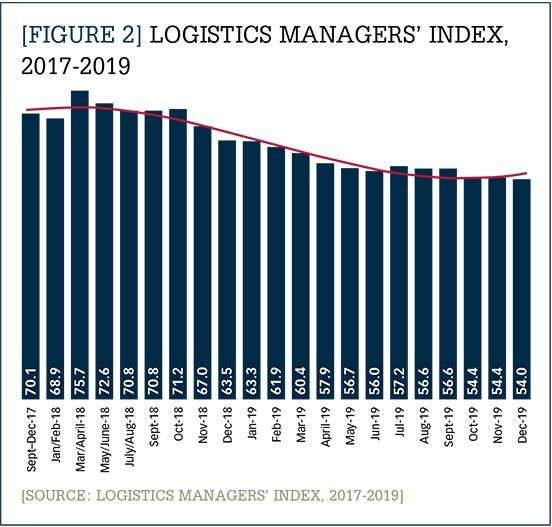
In fact, the December 2019 LMI reading of 54.0 (rounded up from 53.96) was the lowest score in the 40-month history of the index (see Figure 2). It is down considerably (-9.5) points from December a year ago when the LMI's overall score was 63.5.
While we are still registering growth in the logistics industry, the rate of that growth has been slowing continuously over the past 12 months. Throughout much of 2018, the index registered high levels of growth in the low-to-mid 70s, but then growth began to taper off in late Q3/early Q4. The LMI has trended slowly downward since then, with the nine lowest scores in the history of the index being recorded since March 2019.
Overall the LMI seems to indicate that the United States is currently in an uncertain economic time. While it is possible that we are through the "soft patch" we hit last year, many chief financial officers are still concerned about a recession due to the ongoing trade wars and weakness in other parts of the world.2
Transportation's dynamism
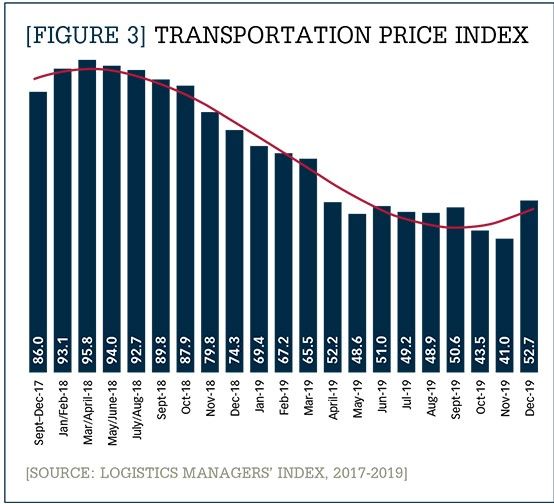
Transportation metrics—which include transportation price, transportation capacity, and transportation utilization—have proven to be the most dynamic measures in the LMI. For most of 2018, Transportation Prices reached into the 80s and 90s, which—considering the scale only goes up to 100.0—is very high. (See Figure 3.) This lined up with the period of growth we saw in the economy. Similar to the overall index, Transportation Price began a dramatic slide starting last fall. However, in December the Transportation Price Index was up 12.0 points to 52.0, from the previous month's reading of 41.0 (which was the lowest point of any metric in the history of the index). Despite the increase, the number for December 2019 was still down sharply (-21.6) from the same time a year ago, when it sat at 74.3. While the metric shows that transportation prices in December were rising, we would actually expect prices to be doing so at a much faster pace, as it is generally a busy month for retail and delivery. It remains to be seen whether the Transportation Price metric will continue to trend upward, or if it's foray into growth in December was a one-time blip tied to the holiday season.
Meanwhile Transportation Capacity was consistent at 57.9, increasing very little (+0.5) from November's reading. However, it should be noted that it is down significantly (-23.9) from December 2018, as there was an excess of capacity built up in 2018, with record fleet orders being placed to match that year's exceptional demand for transportation. Interestingly, Transportation Utilization, the rate at which existing capacity is being used by firms, reached its lowest ever reading, and first-ever negative score, at 47.9. This is down 17.1 points from the December 2018 reading, likely because the transportation market has cooled significantly since then.
Inventory contraction
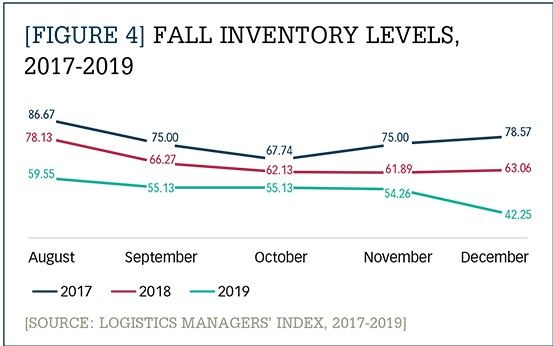
Historically, inventories have grown in Q3/Q4. However, in 2019 we saw lower than expected rates of growth from August to November and active contraction in December. This is the first negative score for our Inventory Levels metric, which is down sharply (-12.0) to 42.3. It is possible that this contraction is tied to the mass movement of goods due to the holiday season or firms burning off inventories that had been built up previously in an effort to avoid tariffs3 or some combination of the two. Figure 4 compares Inventory Levels from August through December in 2017, 2018, and 2019. Because the LMI captures both manufacturing and retail inventories, we are also likely seeing the dragging effects of the slowing manufacturing sector weighing on this metric.
Inventory Costs are also down slightly (-1.95) to 63.4. While this reading still shows signs of consistent growth, it is worth pointing out that in the previous two years, there were only two readings below 70, and September through December 2019 were all below that value. Inventory Costs are still increasing, but at a slower rate than we had previously recorded. We believe that inventory costs are increasing at a slower rate because inventory levels are growing at a slower rate and because warehouse utilization is also not increasing as quickly.
Based on these inventory metrics, there is reason to believe that companies are backing off on their inventory growth. In particular, as Figure 4 shows, companies did not build up their inventories in advance of the holiday season nearly as much as in previous years. This may be a signal that companies expect sales to be decreasing, or at least not growing.
Warehousing prices continue to rise
Contracting Inventory Levels paired with increasing Inventory Costs could be related to the increase in Warehousing Prices, which is up (+4.9) to 73.2—its highest level since March. The increasing prices are likely due to two distinct factors:
- There was no growth in Warehouse Capacity in December, as it was down (-2.13) to 50.0.
- Due to the increasing popularity of same- and next-day delivery, more facilities are being located close to large population centers in what tends to be more expensive real estate.
In other words, warehouses are not being built quickly enough to keep up with growing demand, and the facilities that are the most attractive at the moment tend to be the most expensive. Finally, Warehouse Utilization, or the rate at which existing warehouse space is being used by firms, is somewhat consistent (-0.5), reading in at 60.0.
Slowing growth
The December LMI reading marks two years and 16 consecutive readings indicating growth in the logistics industry. However, it also marks 12 consecutive months of declining rates of growth. As the overall LMI metric currently sits at the lowest point in its 40-month history, it clearly indicates a continued trend of slowing yet steady growth in the logistics industry.
It is important to note that growth rates will likely vary by industry. The LMI is unique in that it captures both consumer and manufacturing activity. This seems to align with recent reports of growth in consumer sentiment and spending and a slowdown in manufacturing.4 Logistics often functions as a leading indicator, helping us to know where the economy is heading. The slow, steady growth of metrics tracked in the LMI likely portends slow, if unspectacular, growth in 2020.
Authors' Note: If you would like to participate in the LMI survey please use this link: https://colostate.az1.qualtrics.com/jfe/form/SV_3WXHydQR4dHMtVz.
Notes:
1. For a more comprehensive discussion of the December 2019 report, access the PDF version of the report here: https://www.the-lmi.com/december-2019-logistics-managers-index.html. The January 2020 report is available at https://www.the-lmi.com/january-2020-logistics-index-report.html.
3. Smith, J. (2019, November 6). Shipping Imports Slipping While Companies Are 'Burning Off' Inventories. Wall Street Journal: https://www.wsj.com/articles/shipping-imports-slipping-while-companies-are-burning-off-inventories-11573073354
4.H. Torry, "U.S. Consumer Spending Picks Up, While Manufacturing Declines," Wall Street Journal, Feb. 14, 2020: https://www.wsj.com/articles/u-s-retail-sales-increased-0-3-in-january-11581687089


