


It seems that almost all senior supply chain executives have transformation on their minds these days as they become increasingly aware of the growing volatility in their respective markets. Some are just beginning to think about how to redesign their legacy supply chain networks. Others are already well into their journey—some as much as seven years—and they know how hard the transition can be. Those that haven't started yet have no idea of what lies ahead of them.
We believe that to kick start any design or redesign of enterprise supply chains, you first need to interpret customer expectations and then use the insights gained to guide the corresponding internal re-engineering work. In fact, we will go further than that and contend that, for successful transformation of your enterprise supply chains, you must consciously design all your internal activity and external interactions with customers and suppliers in mind. The days of just letting supply chains evolve are gone forever.
For that reason, we are introducing two frameworks that will become vital filters in support of the transformation process. Our Dynamic Alignment model1 is a core filter, or heuristic, because it provides a method by which we are able to keep the enterprise aligned with the ever-shifting marketplace. This important concept is reinforced by Roger Martin and others with their notion of "design thinking." Essentially, these heuristics cut through complexity; and this is key to guiding substantial change in the supply chain.
Introducing Dynamic Alignment
The Dynamic Alignment model was born as a concept in 1989 and has been developed and refined continuously since then. It was the joint effort of John Gattorna and Norman Chorn.2 The first public paper on this new notion (originally called Strategic Alignment) was presented at the International Conference of the Strategic Management Society, Stockholm, in 1990.3
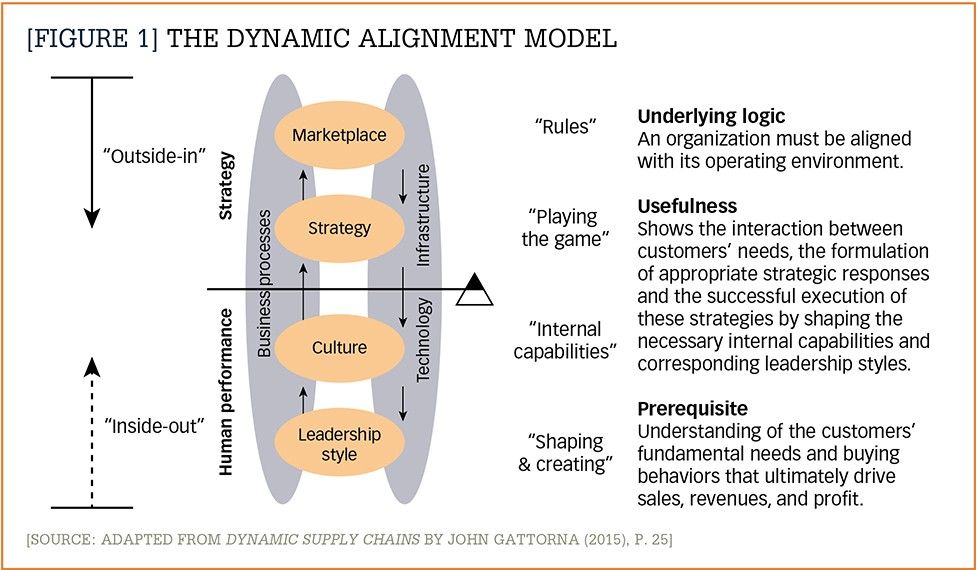
In conceptual terms, it represented the bringing together of the external marketplace with the internal culture and leadership of the enterprise, linked by operational strategy. The four discrete levels of this model are depicted in Figure 1.
The model developed out of frustration with the lack of any robust theory at the time to explain the role of logistics operations (later to evolve into supply chain operations) and how these should be designed and managed to most cost-effectively support the organization's business strategy. The combination of academic insights from across several management disciplines, plus work with diverse clients, was distilled to the four core elements that need to be aligned in order for an enterprise to perform well. Interestingly, this four-level model was later found by our clients to be relevant for all aspects of enterprise performance, not just the supply chain.
The core concept represented by Dynamic Alignment is that organizational performance is optimized when the strategy and internal capability of the organization are "aligned" with the marketplace in which it operates. The more precise the alignment is, the better. Essentially, this "outside-in" approach argues (backed by research) that a firm's "fit" with the market and the corresponding operating environment is the key to sustainable performance.
Dynamic Alignment assumes that there is no universally "good" strategy, "right" culture, or leadership style—everything is situational. This assumption is supported in academic research and in our own practical experience with multiple clients. Different marketplaces require different strategies and corresponding internal capabilities.
Since the early days of its introduction as a concept, fieldwork has continued for over three decades, at every level of the model, in an effort to fill in the gaps and get it to a more granular level.
A behavioral metric
An important breakthrough in the practical application of the Dynamic Alignment model came via our early focus on level 4, leadership style. This had been a shared interest and we had a hunch that, in the end, the leadership and leadership style of an enterprise would prove pivotal to the success of that enterprise. And so it proved to be!
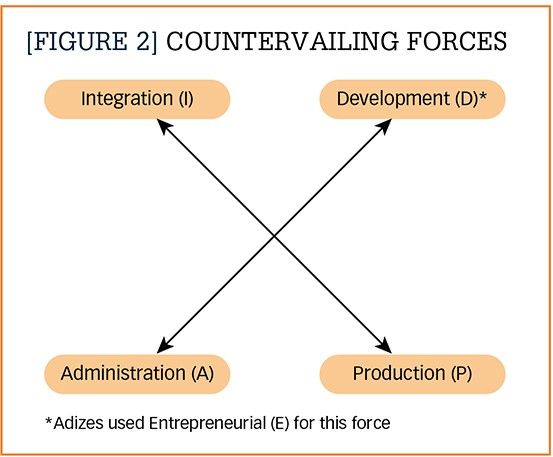
We studied the original work of Jung,4 and later efforts by Adizes5 and Faust6 to interpret Jung's work into a more pragmatic, usable framework to describe the styles of individual executives and the forces that shaped their behavior as leaders. For this purpose, Adizes7 had resolved all the psychological forces identified by Jung into two pairs of countervailing forces, that is "entrepreneurial" (E), opposed by "administration" (A); and "producer" (P), opposed by "integration" (I), as shown in Figure 2.
At about the same time, academics and consultants were starting to use methods based on the same Jungian underpinnings to interpret the differences they saw in groups of people, especially to analyze organizational cultures. If you look at what has become known as the Competing Values Framework8 developed by Cameron and Quinn in the 1980s, you will see that the four forces or dimensions that it uses equate closely to those used to define leadership by Adizes.
Our important breakthrough idea was to realize that these methods of classifying human behavior at the individual and group levels (that were being used to understand more about leadership and corporate culture) could also be used to classify customer behavior—whether they be individual consumers or business customers involving a number of executives involved in decision-making units.
This insight gave us a common metric to describe activity at three levels of the Dynamic Alignment model, and it was not difficult to modify the method to describe the inanimate second level—operational strategy—using the same behavioral metric.
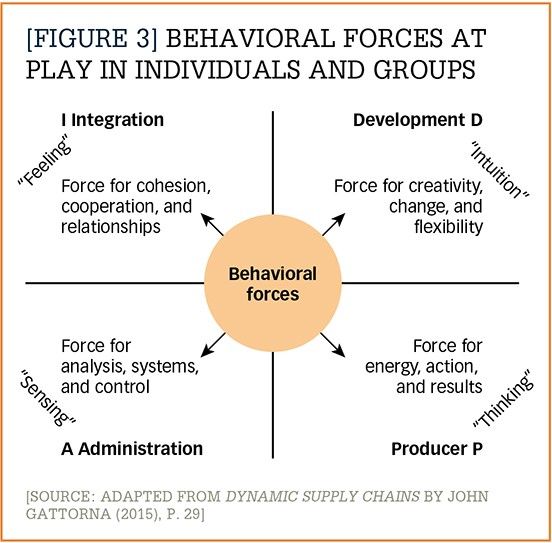
After substituting "development" (D) for Adizes' "entrepreneurial" (E), the P-A-D-I Logic coding system, which could be applied at all four levels of the Dynamic Alignment model, was born. The generalized version of the P-A-D-I metric is shown in Figure 3.
The universality of the metric for describing how both individuals and groups of individuals behave can be seen in a few examples:
- Customers who are loyal, want a long-term relationship, like the reassurance of brand, and are not overly price-sensitive, could be described as "I" customers.
- If we were running an operation that was very focused on maintaining controls, security, tight systems, accuracy, and avoiding risk—the old-fashioned model of a bank—we would have an "A" subculture.
- A highly creative manager, who is always pursuing new ideas and the latest R&D, with little interest in maintaining the status quo, might be described as a "D" leader.
Inherent in the Dynamic Alignment model is the concept that supply chains are driven by people. The archetypes that emerge using the P-A-D-I behavioral metric provide a way to categorize what different customers value most, the response strategies that are appropriate, the internal capabilities and subcultures that must be in place to deliver these strategies, and the leadership styles that work in different situations. Taken together, these enable us to define the types of tailored supply chains that are required to deliver value to different segments of customers.
Sixteen archetypes
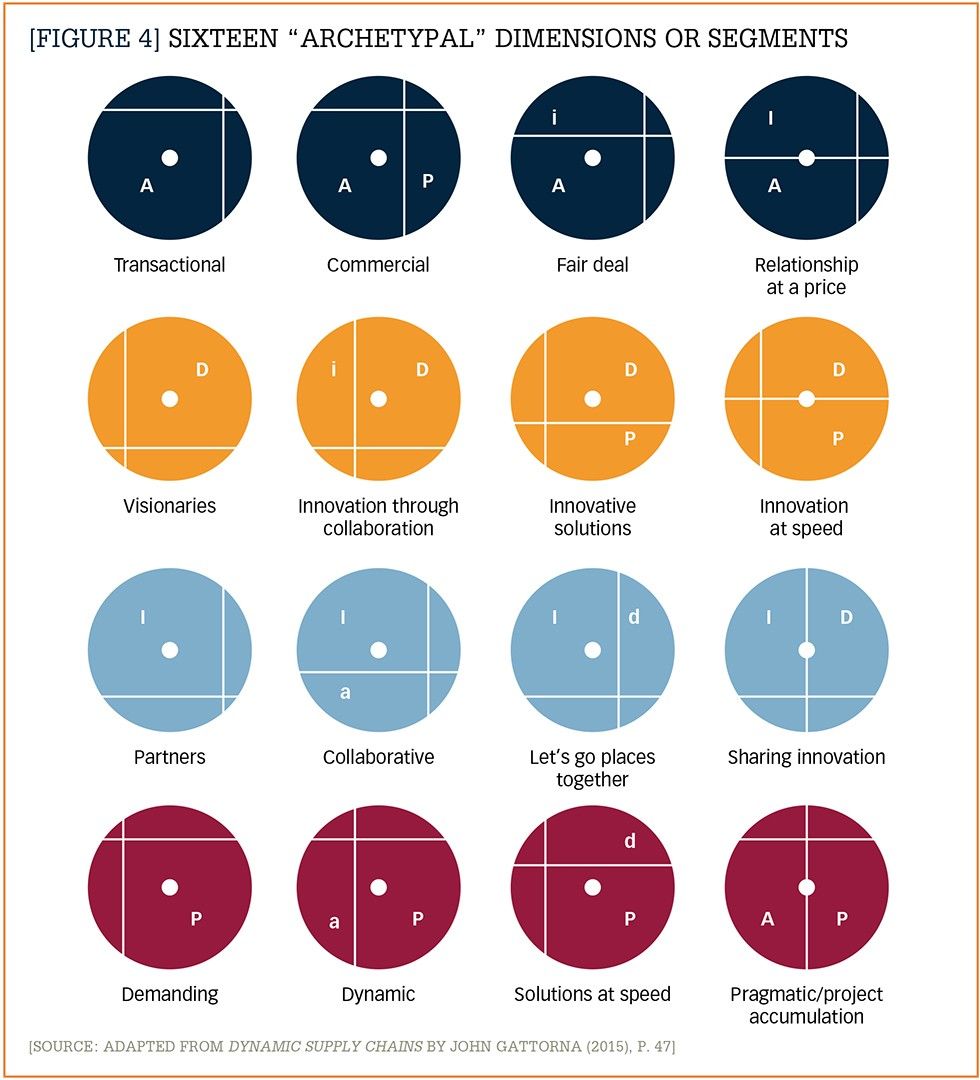
When looking at a marketplace, the classification scheme that results from applying the P-A-D-I metric to markets enables 16 archetypal groupings (or segments) of customers to be identified; these are depicted in Figure 4. We have labeled them with a summary descriptor to capture the essence of each segment. You will note that the method we have developed to depict the segments draws on a summary position in the P-A-D-I matrix, and the position of the center of gravity indicates the bias in each of the 16 "logics."
The significance of the behavioral metric described above cannot be underestimated because it overcame a major impediment to progress: the ability to describe and compare the four key performance elements at play in any enterprise. As engineers well know, you can't compare apples, oranges, pears, and bananas; you have to reduce everything to equivalent apples for comparison purposes.
This codification of each layer in the Dynamic Alignment model allows us to directly link and compare what is in the customer's mind and, therefore, how we should design the appropriate responses. The direct connection is critical and is, in fact, what has been missing in all attempts to develop viable operational strategies to date.
The understanding of how to describe all four levels in the same behavioral metric is akin to discovering something that has been there all the time, but is, as yet, unseen. It is like "hiding something in plain sight"! At last we have the common language we have been searching for.
We see this problem before our eyes, acting out every day inside the business, between the functions, where different language, terminology, and metrics are used, thus making it near impossible to communicate effectively across the business. If we have a problem as fundamental as this inside the enterprise, it's not surprising that we have an even bigger problem truly understanding the mindset of our external stakeholders, especially our customers and suppliers.
Nelson Mandela captured the essence of the problem very succinctly in another context when he commented that "... without language, one cannot talk to people and understand them; one cannot share their hopes and aspirations, grasp their history, appreciate their poetry, or savor their songs. I again realized that we were not different people with separate languages; we were one people, with different tongues."9 It's the different tongues that are the real problem.
Design Thinking
The Design Thinking concept, as articulated by Roger Martin,10 sits well with our Dynamic Alignment model, even though it came some two decades later.
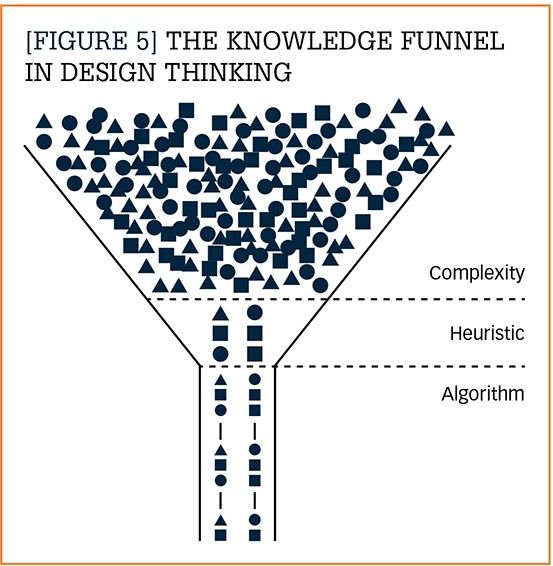
Martin introduces the notion of a knowledge funnel. He refers to the open end of the funnel as where all the mystery and complexities reside, as in our increasingly complex operating environment.
He speaks of the need for a "heuristic" through which we filter these mysteries and complexities to reveal patterns that can be acted upon. We see our Dynamic Alignment model as one such heuristic, because it helps to reveal patterns of behavior in the marketplace which require different responses. We call these patterns customer behavior segments.
Once we can see the patterns (or segments in this case), it is possible to design specific, repeatable processes to drive the efficiency at scale that we all so desire. This industrialization of the solution identified in the heuristic is what Martin refers to as the "Algorithm." The idea of filtering complexity through a heuristic to reach this outcome is depicted in Figure 5.
The Design Thinking concept has transferred the designer's mindset to the business world; and it has been very influential in how large and small companies now approach innovation. In this context we argue that innovation does not only refer to new products, new customers, or new technologies—it is also a mindset that is needed to continually improve performance with our current products and customers.
Multiple segments
The next critical stage of the heuristic that developed from our ongoing work with clients was the recognition that most organizations were not serving one segment but were facing an array of behavioral segments with different needs and expectations. Thus, they could have strategies and a supply chain that were well-aligned with one segment, but could be missing the mark with a large part of the residual market because they had not recognized the diversity they faced. And this is a very common scenario—"one-size-fits-all" supply chain strategies.
Over time, it also became apparent that there was some pattern even to the range of segments. Across diverse industries we found that the five most frequently seen customer segments were collaborative, transactional, and dynamic, which reflected familiar ways in which individuals and businesses thought about buying particular categories. We have also seen that the structure of buying for projects is so influential in terms of different expectations that it can override all other influences and, hence, we have learnt to define it as a different segment. And, finally, there are occasions where the needs of the situation are so outside the norm that conventional ways of operating are not appropriate and innovative solutions are required. Thus, of the 16 archetypal options implied by our coding method mentioned earlier, five in particular were most often required.
Dynamic Alignment implies that each of these segments requires specific strategies and underpinning capabilities. We explore these segments and the appropriate supply chain responses in more detail in chapters 4 and 7 of our book Transforming Supply Chains.
We have also seen, however, that customers change their behavior from time to time. Under duress, or for short periods, they may shift their priorities—and move, for example from being primarily price-buyers (transactional) to wanting a solution at any cost (innovative solutions). This is why we have used the term "Dynamic" Alignment for our model.
Very large organizations can also exhibit a range of buying behaviors within the same organization. A large retailer, for example, can be buying from the same supplier several home-brand ranges in transactional mode; one-off promotional ranges in dynamic mode; and they may also have a team working with a supplier in innovation mode on completely new product categories. All at the same time!
From static to dynamic design
With the help of "outside-in" thinking, as espoused in Design Thinking and our proprietary Dynamic Alignment model, we can chart a path to more dynamic supply chains that have the capability to serve an array of different needs in the market without constant adjustment and customization. This conscious linkage between a customer's buying behaviors and internal strategy and capabilities is the starting point for more effective supply chains.
Notes:
1. Dynamic Alignment is a registered trademark of Gattorna Alignment.
2. Norman Chorn was a partner in the Gattorna Strategy consulting business from 1989 with a particular expertise in cultural capability.
3. N.H. Chorn, K.L. Myres, and J.L. Gattorna. 1990. "Bridging Strategy Formulation and Implementation," unpublished paper presented to the 10th Annual International Conference of the Strategic Management Society, Stockholm.
4. See C.G. Jung, The Collected Works of CG Jung Volume 6: Psychological Types, eds. G. Adler, M. Fordham, and H. Read (translated by R.F.C. Hull), (Ewing, N.J.: Bollingen Series 2.0, Princeton University Press, 1971).
5. I. Adizes, How to Solve the Mismanagement Crisis (Dow-Jones-Irwin: 1979).
6. G.W. Faust, president, Faust Management Corporation, Poway, California (previously president of the Adizes Institute).
7. Adizes, 1979.
8. K. Cameron and R. Quinn, Diagnosing and Changing Organizational Culture: Based on the Competing Values Framework (San Francisco: John Wiley and Sons, 2011).
9. N. Mandela, Long Walk to Freedom (Boston: Back Bay Books, 1995), p. 94.
10. R. Martin, The Design of Business: Why Design Thinking Is the Next Competitive Advantage (Boston: Harvard Business Press, 2009).
- High-performance supply chains do not just evolve; they have to be consciously designed to fit specific product-market combinations.
- The design or redesign process must work from "outside-in"; not the other way around. The field of Design Thinking supports this view.
- Dynamic Alignment is our proprietary filter or heuristic—it enables us to see patterns in the market and the demand data, and respond with precision.
- The secret sauce in the Dynamic Alignment model is its ability to describe every level in the same way, using a coding method that involves a common behavioral metric. The metric is akin to having a common language to use in communicating inside and outside the enterprise.
- The framework results in 16 possible archetypal groupings of customers in a marketplace. Of these, any five dominant groupings can account for upwards of 80% coverage of a target market.
- It is clear from experience across industries that many organizations potentially face more than one buyer behavior segment within a single customer, and up to five behavioral segments in their target market.


