


The new product and service development (NPSD) process is a major endeavor for any firm. (For a quick review of the components and outcomes of the process, see the sidebar, “New Product and Service Development 101”.) Recently, in an effort to reduce new product lead times and costs while improving quality, the NPSD process has undergone extensive revision and rethinking to become more collaborative.
NEW PRODUCT AND SERVICE DEVELOPMENT 101
The new product and service development (NPSD) process embodies all the steps necessary to take a product and/or service from concept to full production. One can envision NPSD as consisting of several linked stages such as:
- advanced research,
- product/service concept,
- specification development,
- product development,
- pilot,
- operations, and
- reincarnation/disposal
Sometimes referred to by such names as “simultaneous engineering” and “concurrent engineering,” the collaborative NPSD process typically involves multifunctional teams made up of both internal and external stakeholders. These teams work closely together and consider all stages of the product’s life cycle. For example, the development process will consider not just the initial design of the product but also issues relating to operations planning and execution, such as the ideal manufacturing processes and potential product cost. Furthermore, one function or group no longer manages each activity of the development process in isolation.
Research shows that such a collaborative NPSD process can provide a competitive advantage. My company IndustryStar Solutions LLC, which provides on-demand supply chain services and software that empower teams to bring new products to market faster, recently partnered with Dr. Sime Curkovic of the Haworth College of Business at Western Michigan University on a series of in-depth interviews about NPSD with 126 professionals across 25 industries. Participating companies included: Whirlpool Corp., Toyota Motor Corp., Stryker Corp., Deere and Company, Coca-Cola Co., General Dynamics Corp., and Parker-Hannifin Corp, among many others. Our research produced the following findings:
- 80% of companies surveyed said collaborative NPSD has helped optimize development cost, ongoing production cost, quality, performance, and customer satisfaction.
- 75% said that collaborative NPSD has resulted in a competitive advantage.
- 82% planned to increase collaborative NPSD in the future.
- 85% wanted to start collaboration earlier in the NPSD process.
However, the survey also revealed that companies face many obstacles in the way of conducting an effective NPSD process. For example:
- Only 50% of the surveyed companies said they were currently satisfied with their NPSD results.
- 70% claimed they lacked a process to integrate suppliers into NPSD.
- 50% of respondents said their technical staffs were unwilling to share designs with suppliers. This finding contradicted most respondents’ belief that there was trust between their company and their suppliers.
In the interviews, the three most cited obstacles for NPSD were: 1) talent, 2) communication, and 3) alignment of stakeholders.1
To help companies address these three main challenges, we developed the PACE assessment tool. The PACE method is meant to help leaders determine the baseline performance of their company’s current NPSD process and what specific actions could help generate greater NPSD results. The assessments are not meant to provide definitive scores, rather they are intended to be viewed as a guide to best practices. The acronym “PACE” comes from the first four steps of what the five-step assessment covers: 1) people; 2) automation; 3) collaboration; 4) empowerment; and 5) realization. We highly encourage companies to do the assessments in this order.
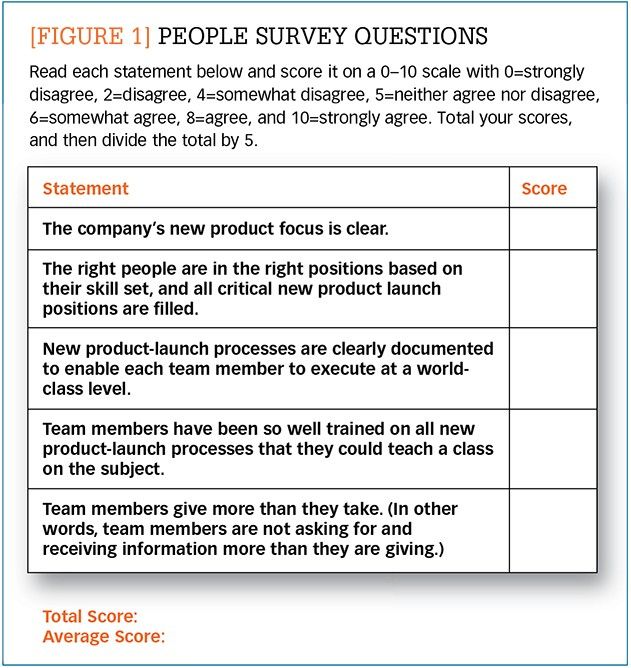
Step 1: Assess your people
The single biggest key to the success of a new product launch is having amazing people. No process or software technology can add as much as people with clear roles, documented processes, and standardized training. If you want to enhance your new product launches, then it is critical that you first conduct a thorough assessment of the current state of your people, roles, processes, and training.
One thing that is particularly important to assess is how well your team understands the company’s new product focus. The natural impulse that many of us have is to jump right into coaching our teams, but we need to outline our business “game plan” first. Our teams need clarification on what business we are in and what products to focus on. This might seem simplistic, but verbalizing what the company’s focus is can sometimes be more difficult than it first appears. For example, is General Motors in the automotive market or the mobility market? Should the company be focusing on developing electric vehicles or mobility services?
As leaders, we need to communicate a clear vision for where we are headed before striving to align our people for the road ahead. Once our people are onboard with our vision, we need to ensure our team members are in roles that maximize their current skill sets and the value that they add to the company. Further, we need to document our processes, which is typically an area that we can all get better on. Additionally, it is necessary to provide forums for consistent training and enhancements to our processes.
It may seem appealing to assume you are fine in the people department, but you skip this step in the assessment at your own peril. Have your leadership teams and your extended new product and service development team complete the survey in Figure 1 to conduct an honest assessment of the current state of your people. Remember, every company can get better, no one is perfect.
Enlarge this image
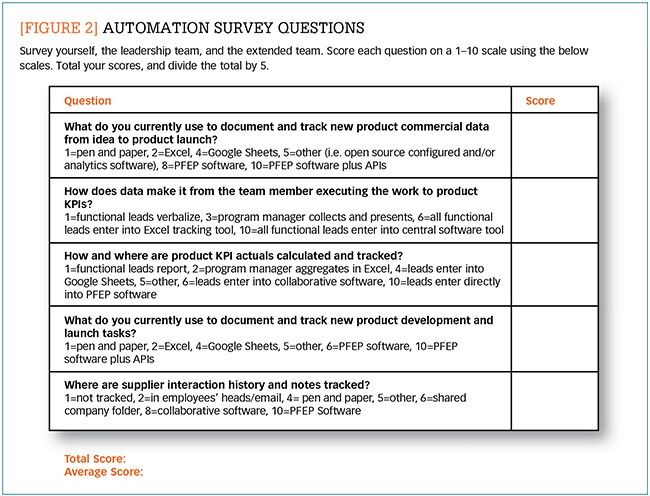
Step 2: Assess your automation
You can also accelerate the speed of product launches by automating repetitive tasks. When it comes to the supply chain part of new product development—sourcing the materials and services needed—many companies have invested heavily in software productivity tools, such as e-sourcing and enterprise resource planning (ERP), to successfully automate many of their repetitive tasks. Still, many find themselves relying upon more manual tools such as Microsoft Excel early in the product ideation stage to organize a product’s commercial bill of material (BOM) for potential suppliers, directional quotes, and estimated lead times. Yes, Excel is a fine product, but it’s built for flexible one-off analysis, not for repeatedly developing and launching new products with large BOMs. It’s simply not the right tool for the job.
Not to mention that an industry best practice for decades has been to essentially expand the commercial BOM and adopt “a plan for every part” (PFEP). A PFEP involves tracking information such as component costs, lead times, and supplier data in one large spreadsheet. This “spreadsheet of all spreadsheets” often includes more than 35 columns of data. Thus, for a 100-line item BOM, one’s PFEP can equate to 3,500 data inputs that need to be manually inputted.Although PFEP is a wonderful tool, it’s often abandoned due to the immense individual maintenance effort required.
Innovative companies, however, are deploying automated PFEP software with application programing interfaces (APIs) to bridge the technology divide between product lifecycle management (PLM) systems and ERP systems. This step up in technology helps to accelerate new product launch speed.
The survey in Figure 2 will help you quickly determine your current level of product development and launch automation. You will also need to review new product key performance indicators (KPIs), data, and information-sharing processes.
Enlarge this image
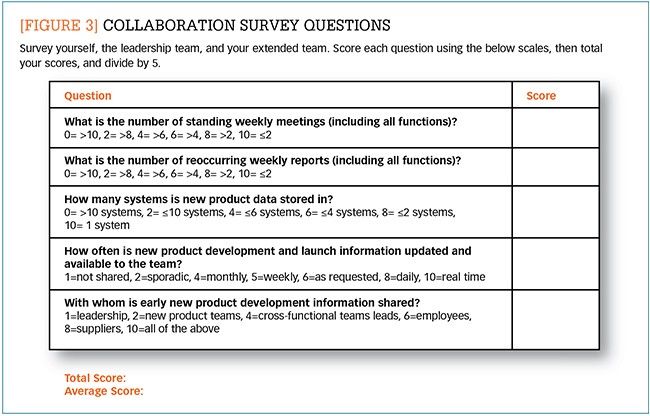
Step 3: Assess your collaboration tools
The extra work and time spent on the NPSD process is often the result of inefficient collaboration, such as poor communication, data rework, and having “duplicate playbooks.” The good news is that large step changes in productivity—and as a result in speed—can be realized in a surprisingly short amount of time simply by sharing the least amount of right information at the right time. For example, as you move closer to producing a prototype of your product, you will need more information in the product’s PFEP. You should partner with your engineering colleagues to know what specific data they need at each new product development milestone. This ensures that you are not wasting time adding extra data too early in the process. It also ensures that the process is not held up by waiting for a specific piece of information. Improving how you share new information can improve collaboration and increase the speed of the development process.
The questions in Figure 3 will help you quickly determine the level of productive collaboration among your team and the extended enterprise.
Enlarge this image
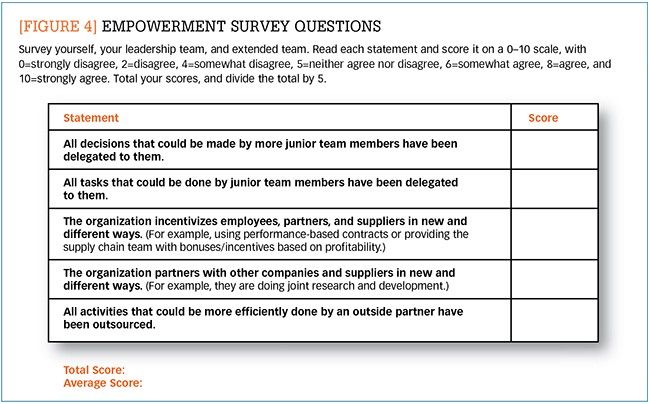
Step 4: Assess your empowerment
When we peel back the onion, we often find companies are doing far too many things themselves, which slows down the new product launch process. Firms should only do the specific tasks that they have a competitive advantage and/or a strategic reason to do. Too often firms do a particular task just because it is what they have always done or because it is what their competitors do. The net result is that companies spend far more money and time completing a task internally when they could easily outsource it to a strategic partner to execute at a lower cost. Outsourcing not only frees up valuable capital, it also frees up valuable time.
We should empower our partners to do the tasks that they excel at, while focusing internally on those tasks where we can provide competitive value. As an example, are we managing prototype-part buying when a supplier could deliver a completed prototype product at lower cost?
Empowerment is more than simply deciding what your company should do and not do. Often, leaders need to delegate more tasks to team members, giving them the chance to develop new skills and responsibilities. For example, is the vice president of procurement approving all commercial request for quote (RFQ) packages when a director could approve them? Is a manager assembling all the logistics routes when a lead logistics coordinator could determine them? If you want to accelerate your NPSD, you need to empower your team to do more.
The questions in Figure 4 will help you quickly determine the level of empowerment of your team, which is critical for speed.
Enlarge this image
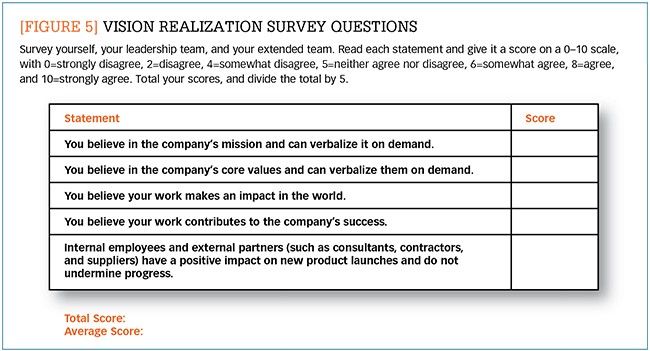
Step 5: Assess vision realization
The companies that are the most successful at new product and service development, such as Apple and Tesla, are able to tie the process to realizing the company’s mission. Those leaders who choose to inspire their teams, who craft a noble mission and the core values to support it, and who believe in the mission deep in their souls are near impossible to keep “pace” with. They will realize their mission faster than those who lack that passion. You can assess how well you are performing in this area by taking the survey outlined in Figure 5.
Enlarge this image
There is an argument for making this assessment process follow (or be combined with) the first assessment area (people), but that’s largely a matter of preference. However, if you find yourself with a low people score and/or in a turnaround situation, consider following improving your people with improving your “vision realization” to accelerate NPSD results.
Interpreting your scores
The score for each step should be viewed as a baseline diagnostic from which to continuously improve upon. Afterall, excellence is a continuous improvement pursuit; there is no end destination for the way in which you develop and launch all new products. Specific solutions to each question in the PACE Method will also vary by industry, company, and product. Tailoring the remedy is the art of maximizing the PACE Method. Your scored self-assessment should act as a starting point, provoking follow-on questions that enable deeper exploration into areas that could improve your new product development process.
We advise supply chain leaders, their teams, and all functions involved in the NPSD process to take the full assessment. The average scores for each step should help you to prioritize what step to focus on first. If a score of 9 or higher is attained for a step (for example, people), then you should focus on the next step in the process that is below 9. Have your whole team repeat the assessment process monthly until scores average 9 or higher for each step. To realize the fastest results, we would advise prioritizing improving one step in the PACE Method at a time. Once scores average 9 or higher for each step, shift your assessment efforts to quarterly.
Pick up the pace
Our experience and research have demonstrated that companies that repeatedly develop and launch innovative products generate outsized profits. Companies that want to be innovation leaders, therefore, need to accelerate their collaborative new product and service development process. The PACE Method can serve as a helpful guide to determining your company’s NPSD baseline performance from which you can then continuously improve upon.
There are no single actions that guarantee new product introduction supply chain success. Insights and tactics from trailblazing leaders simply highlight select actions that organizations can take to accelerate new product launches.
The PACE Method represents a significant opportunity to discover impactful practices that can produce gains in new product development and launch productivity. The key, as with anything new, is to get started.
Notes:
1. It is important to recognize the limitations of our research. The limited sample size and industries involved constrains the generalizability of the findings. Additionally, the qualitative approach does not support causality and the ability to empirically test propositions and hypotheses surrounding NPSD and reducing cost, timing, and risk.


