After dealing with tight capacity and high freight rates in 2018, shippers thought they’d seen the worst of it, and that 2019 would be back to business as usual. That was true ... until COVID-19 came along.
Contributing Editor Toby Gooley is a freelance writer and editor specializing in supply chain, logistics, material handling, and international trade. She previously was Editor at CSCMP's Supply Chain Quarterly. and Senior Editor of SCQ's sister publication, DC VELOCITY. Prior to joining AGiLE Business Media in 2007, she spent 20 years at Logistics Management magazine as Managing Editor and Senior Editor covering international trade and transportation. Prior to that she was an export traffic manager for 10 years. She holds a B.A. in Asian Studies from Cornell University.
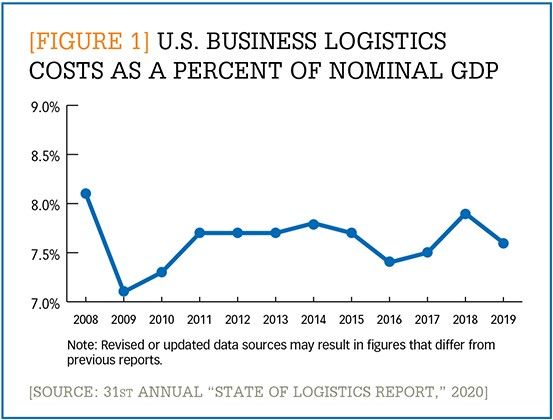
Just one year ago, in our annual “State of Logistics” special issue, we predicted that after navigating tight transportation capacity and soaring freight rates during 2018’s economic boom, shippers and carriers would spend 2019 trying to “bring back a sense of normalcy.” And things did seem to be headed in that direction. Total U.S. business logistics costs in 2019 grew by just 0.6%, a relief after the staggering 11.4% increase seen the previous year. Costs in 2019 represented 7.6% of the $21.43 trillion U.S. gross domestic product (GDP), down from 7.9% in 2018. (See Figure 1.)
[Figure 1] U.S. business logistics costs as a percent of nominal GDP Enlarge this image
But by early 2020, however, “normal” was out the window. The global COVID-19 pandemic has “decimated supply chains, scrambled logistics capabilities, and destroyed huge swaths of demand,” write the authors of “Resilience tested,” the Council of Supply Chain Management Professionals’ (CSCMP) “31st Annual State of Logistics Report.” Yet they were able to sound at least one positive note amid the crisis: The pandemic has made it obvious to all that logistics is essential to the economy and to the public good. The report also reinforces an important lesson: In times of disruption, supply chain resilience, flexibility, and agility will be fundamental to companies’ success, and even to their survival.
Written for CSCMP by the consulting firm Kearney and presented by Penske Logistics, the “State of Logistics Report” provides an overview of U.S. business logistics costs for the past year. It also includes a review of macroeconomic factors affecting logistics costs, analysis of each major logistics sector, historical data, and a look at trends that will shape logistics activities in the future. This year, each sector is also considered in the context of the pandemic, with recommendations for shippers and service providers on how to mitigate its impact.
Transportation costs: Up and down
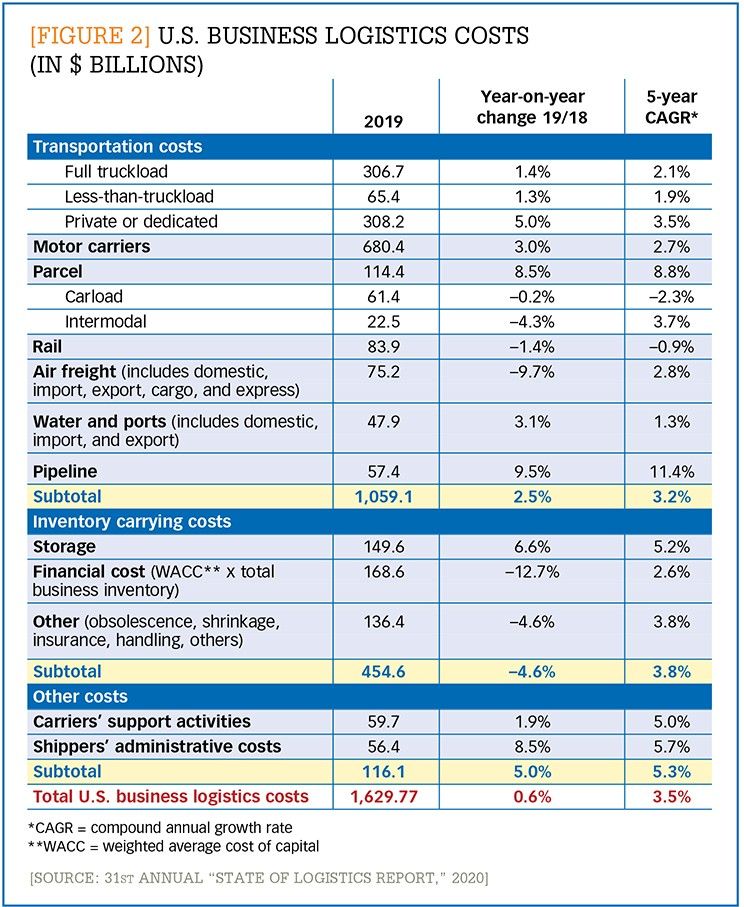
For three decades, the core of the annual report has been its analysis of the previous year’s business logistics costs, which are broken down into three main categories: transportation costs, inventory carrying costs, and “other” (support and administrative) costs. The grand total for 2019 was $1.63 trillion, with the lion’s share—$1.06 trillion—attributed to transportation. (See Figure 2.)
[Figure 2] U.S. business logistics costs (in $ billions)
Enlarge this image
Overall, transportation costs grew 2.5%, a sharp drop from the 9.2% increase seen in 2018. Costs rose for trucking, parcel, and water but fell for air and rail. The following is an overview of last year’s important developments in each segment.
Motor carriers. Overall motor freight costs reached $680 billion in 2019. Expenditures on full truckload (FTL) hit $307 billion, a year-on-year increase of 1.4%—a far cry from last year’s 7.6% jump. Similarly, less-than-truckload (LTL) costs, at $65 billion, were up 1.3%, a respite from 2018’s 8.3% increase. Costs for private fleets and dedicated contract carriage rose by 5%, to $308 billion, as shippers sought to insulate themselves from the capacity problems and high prices of the previous year. On the spot market, average dry van rates tumbled 22%, largely due to the overcapacity that resulted when carriers’ record investments in new trucks collided with declining cargo volumes. The result was a market where shippers “regained buying power, negotiated lower rates, and secured capacity” and carriers had to worry about profitability, the report said. In the first half of 2019 alone, more than 600 truckers went out of business, citing declining demand, falling rates, and higher insurance and labor costs. The second half was even worse as shipment volumes continued to plummet.
Parcel. The U.S. parcel segment grew by 8.5% percent to $114 billion. The parcel sector’s fate rises and falls on e-commerce sales, which grew nearly 15% in 2019. Increased competition and consumers’ rising expectations pushed carriers and shippers to improve last-mile service while reducing their per-package costs. Both FedEx and UPS, for example, began year-round seven-days-a-week delivery. Many shippers began offering a wider range of delivery speeds (such as same-day, time-definite, and two-hour) and alternative delivery options (nights and weekends, lockers, and pick up in store). Last year saw, for instance, both UPS and Amazon partnering with retail chains to begin offering the option of “buy online, pick up in store.”
Rail. The Class 1 railroads saw weaker demand in 2019, and revenues declined by 1.4%, due in part to an industrial recession and reduced demand for coal. Even intermodal volumes, a reliable source of growth—albeit one that is less profitable than carload—declined as lower truckload rates led shippers to shift some intermodal volumes to motor carriers. Nevertheless, the four largest U.S. railroads (BNSF, Union Pacific, Norfolk Southern, and CSX) were able to improve their operating ratios and operating incomes in 2019 through network optimization and productivity improvements.
Water and ports. Overall costs in this segment, which includes container shipping, coastal shipping, and inland waterway barge traffic, grew by 3.1% in 2019, despite declining volumes. On the container side, importers trying to beat the Trump Administration’s January 1, 2019, imposition of new tariffs on Chinese goods caused a surge in inbound shipments in late 2018; the resulting stockpile depressed demand early in 2019, and inbound volumes for the year fell 0.6%, with the biggest declines at West Coast ports. Still, trans-Pacific contract rates from May 2019–April 2020 were 15% to 20% higher than in the previous contract period. That didn’t help container carriers much, as weak volumes “wiped out most of carriers’ 2018 gains,” the report said.
Air freight. Air cargo volumes dropped 9.7% in 2019—the worst showing since the 2009 financial crisis, according to the report. The drop was due to several factors: a slowdown in industrial shipments, especially in the automotive industry; the trade conflict with China; and U.S. tariffs on European aircraft and agricultural products. Cargo tonne-kilometers (CTK) declined by 3.3% over 2018, while capacity increased by 2.1%. It came as no surprise, then, that the East-West average air freight rates, including surcharges, paid by forwarders fell 6% in 2019. Growth in e-commerce and shipments of health care products were among the few bright spots.
Inventory, other costs a mixed bag
Inventory carrying costs, which comprise storage, financial, and “other” costs, tallied $455 billion, a drop of 4.6% over 2018’s total. That was primarily due to a 12.7% year-on-year reduction in financial costs (weighted average cost of capital x total business inventory) and a 4.6% decline in the remaining costs, which include obsolescence, shrinkage, insurance, and handling.
The big story, though, was in storage costs, which grew by 6.6%, to $150 billion. Throughout 2019, warehouse and distribution center rents continued to rise, to an average $6.51 per square foot, while vacancy rates remained at historic lows of 4.8%. Demand, especially for smaller, urban warehouses for e-commerce fulfillment, was strong in the second half of the year, and the 300 million square feet of new supply built in 2019, including a record 100 million square feet in the fourth quarter alone, was quickly leased.
The third major segment of U.S. business logistics costs, “other costs,” encompasses carriers’ support activities and shippers’ administrative costs. The former, which includes freight forwarding and third-party logistics (excluding purchased transportation costs), packing and crating, port services, and similar activities, rose 1.9% over 2018. The latter, which includes shippers’ wages, benefits, and information technology costs, jumped a hefty 8.5%. The report’s authors note that both 3PLs and international freight forwarders contended with declining freight volumes, rising storage and labor costs, a trade conflict with China, and protests in Hong Kong during 2019. While asset-light 3PLs saw declining profits, asset-heavy 3PLs improved profitability by better managing their assets. Some of the biggest freight forwarders were able to grow revenues and profits in 2019, thanks to good capacity management, lower fuel prices, and inventory buildups, as well as a strengthened presence in emerging manufacturing regions like Southeast Asia.
Preparing for an uncertain future
As in past years, the “State of Logistics Report” includes analysis of important trends or developments the authors believe will have an indelible impact on logistics costs in the future. This year’s focus is on technology, including artificial intelligence, machine learning, augmented and virtual reality, blockchain, robotics, renewable energy, the Internet of Things (IoT), and the 5G wireless communication standard. The authors pay special attention to 5G, which they say will have a “profound” impact on logistics by improving the data transfer speed, capacity, latency, and reliability of autonomous communication among devices, vehicles, and infrastructure. This, in turn, will accelerate the rate of automation in logistics operations, reducing costs and increasing visibility across the supply chain.
In an important departure from previous editions, this year’s “State of Logistics Report” devotes as much attention to the present as it does to the past. Overshadowing every page is the global COVID-19 pandemic. The report considers the current impact of the pandemic on each logistics sector, forecasts the possible near- and long-term consequences, and offers recommendations geared toward each industry segment for navigating virus-related disruptions and mitigating their impact. The following are just a few highlights:
Motor carriers: The recession brought on by COVID-19 will cripple or force out carriers that were already on shaky financial ground in 2019. Shippers should enhance their supply chain resiliency, be a supportive partner to their carriers, and prepare for another capacity crunch. Carriers, for their part, should focus on improving asset utilization, use technology to cut costs, and diversify their revenue sources.
Parcel: Homebound consumers spurred rapid growth in e-commerce, straining carriers’ networks and pushing up costs while providing greater scale and route density. Shippers can mitigate rising costs by matching their service levels to customers’ actual needs. Carriers may benefit from investing in a mix of delivery options and cementing relationships with large shippers.
Rail: Year-on-year traffic dropped by 25% in the first half of 2020, leading carriers to take locomotives out of service, furlough employees, and restructure services and schedules. Shippers can continue to press carriers on speed, reliability, and visibility, while carriers could make additional productivity gains and more use of technology.
Ocean: Inbound container volumes dropped sharply in Q1 of 2020; carriers cancelled many sailings, causing ship and container imbalances, higher spot prices, and port congestion. While the situation has eased somewhat, bargain-hunting shippers should assess carriers’ financial stability and avoid contributing to consolidation and bankruptcies. Carriers, already shaky before COVID-19 hit, need to finalize contract negotiations with sustainable rates.
Air: With nearly half of air cargo carried on passenger planes and 90% of passenger flights cancelled in March and April, capacity suddenly shrank and spot rates shot up. Shippers should expect continued service reductions; while all-cargo services are an option, they are hard-pressed to meet demand that normally moves as belly freight. Carriers can handle demand uncertainty by being able to quickly flex capacity and manage variable costs.
Warehousing: Pandemic-related e-commerce is causing surging demand for warehouse space, especially for grocery and temperature-controlled products, and new facilities are being quickly snapped up. Shippers that plan to increase safety stock and position more inventory closer to online customers must consider how that will impact their space needs. Warehouse operators will face higher costs and more labor shortages, suggesting that the pandemic will lead them to adopt more automation.
The U.S. economy has yet to see the full impact of COVID-19. The pandemic will strongly influence logistics capacity, geopolitical forces, and regulations for some time, the authors of this year’s “State of Logistics Report” predict. To what degree and for how long will depend on the severity and longevity not only of the coronavirus outbreak but also of any resulting recession. Regardless of how it all plays out, shippers, carriers, and 3PLs alike will need all the flexibility, resilience, and creative problem solving they can muster as they navigate the chaos of simultaneous plummeting demand in some sectors and exploding demand in others.
TO LEARN MORE ...
For more than 30 years, the Council of Supply Chain Management’s annual “State of Logistics Report” has quantified the impact of logistics on the U.S. economy and offered forecasts for where the logistics industry is headed. The summary provided in this article represents just a fraction of the statistics and analysis included in this year’s report. CSCMP members can download the full report at no charge, and nonmembers can purchase the report at CSCMP’s website, cscmp.org.
Additionally, CSCMP members can watch a replay of the webinar that accompanied the report’s release, listen to a podcast by two of the reports’ authors, and attend a session about the “State of Logistics Report” at CSCMP’s virtual EDGE conference. Find all the details at cscmp.org.
ROLLING WITH THE PUNCHES
The year 2018, with its sharply rising demand, tight capacity, and dramatically higher logistics costs, was a painful one for shippers. The next year, 2019, was more like old times, with logistics costs rising at a much slower rate. But anyone who was lulled into complacency by that supposed return to normal knows better now.
As the authors of the “31st Annual State of Logistics Report” put it, if you thought 2018 was bad, the extreme disruption and uncertainty associated with the COVID-19 pandemic proved “you ain’t seen nothin’ yet.”
With demand for some products plummeting while demand for others is off the charts, the impact of the pandemic continues to be severe and widespread, affecting every industry and every aspect of logistics operations. Yet some good is likely to come out of an experience nobody wanted, according to the panelists at a webinar following the report’s release.
The sudden changes wrought by the pandemic have pushed supply chain players to place new emphasis on resilience, flexibility, and agility, said Kearney partner and lead author Michael Zimmerman. Agility was critical for food products giant Cargill, which had to accommodate a quick shift in demand from its traditional food service market to grocery, said Jacqueline E. Bailey, North American regional lead at Cargill Transportation & Logistics. Even with a robust integrated business planning (IBP) system for monitoring and forecasting demand, and a disaster-response plan already in place, “COVID-10 has tested our supply chain in ways we didn’t anticipate.”
Most supply chain experts agree that massive disruptions—another pandemic, natural disasters caused by climate change, geopolitical conflict—are possible, and probably inevitable. This recognition should encourage companies to make changes for the long term, not just respond to the current emergency with temporary fixes, the panelists suggested.
Marc Althen, president of Penske Logistics, noted that his company had to respond to unexpected developments—such as a one-third drop in volume in its dedicated contract carriage business, and the need to create touchless proof of delivery and a return-to-work protocol—in a matter of weeks. “As a 3PL, we had to be even more agile and flexible and develop even deeper relationships with our customers,” he said. “But I think we’re going to exit this as a much stronger and leaner company.”
Panelists were unanimous in their expectation that supply chain technology would be critical for successfully managing rapid change on a large scale. Heightened visibility and more efficient data exchange will, for example, “allow companies to speed up the reallocation of resources,” said Craig Fuller, founder and CEO of the transportation information company FreightWaves. “I think we’ll see more investment in supply chain technology in the future.”
First, 54% of retailers are looking for ways to increase their financial recovery from returns. That’s because the cost to return a purchase averages 27% of the purchase price, which erases as much as 50% of the sales margin. But consumers have their own interests in mind: 76% of shoppers admit they’ve embellished or exaggerated the return reason to avoid a fee, a 39% increase from 2023 to 204.
Second, return experiences matter to consumers. A whopping 80% of shoppers stopped shopping at a retailer because of changes to the return policy—a 34% increase YoY.
Third, returns fraud and abuse is top-of-mind-for retailers, with wardrobing rising 38% in 2024. In fact, over two thirds (69%) of shoppers admit to wardrobing, which is the practice of buying an item for a specific reason or event and returning it after use. Shoppers also practice bracketing, or purchasing an item in a variety of colors or sizes and then returning all the unwanted options.
Fourth, returns come with a steep cost in terms of sustainability, with returns amounting to 8.4 billion pounds of landfill waste in 2023 alone.
“As returns have become an integral part of the shopper experience, retailers must balance meeting sky-high expectations with rising costs, environmental impact, and fraudulent behaviors,” Amena Ali, CEO of Optoro, said in the firm’s “2024 Returns Unwrapped” report. “By understanding shoppers’ behaviors and preferences around returns, retailers can create returns experiences that embrace their needs while driving deeper loyalty and protecting their bottom line.”
Facing an evolving supply chain landscape in 2025, companies are being forced to rethink their distribution strategies to cope with challenges like rising cost pressures, persistent labor shortages, and the complexities of managing SKU proliferation.
1. Optimize labor productivity and costs. Forward-thinking businesses are leveraging technology to get more done with fewer resources through approaches like slotting optimization, automation and robotics, and inventory visibility.
2. Maximize capacity with smart solutions. With e-commerce volumes rising, facilities need to handle more SKUs and orders without expanding their physical footprint. That can be achieved through high-density storage and dynamic throughput.
3. Streamline returns management. Returns are a growing challenge, thanks to the continued growth of e-commerce and the consumer practice of bracketing. Businesses can handle that with smarter reverse logistics processes like automated returns processing and reverse logistics visibility.
4. Accelerate order fulfillment with robotics. Robotic solutions are transforming the way orders are fulfilled, helping businesses meet customer expectations faster and more accurately than ever before by using autonomous mobile robots (AMRs and robotic picking.
5. Enhance end-of-line packaging. The final step in the supply chain is often the most visible to customers. So optimizing packaging processes can reduce costs, improve efficiency, and support sustainability goals through automated packaging systems and sustainability initiatives.
Geopolitical rivalries, alliances, and aspirations are rewiring the global economy—and the imposition of new tariffs on foreign imports by the U.S. will accelerate that process, according to an analysis by Boston Consulting Group (BCG).
Without a broad increase in tariffs, world trade in goods will keep growing at an average of 2.9% annually for the next eight years, the firm forecasts in its report, “Great Powers, Geopolitics, and the Future of Trade.” But the routes goods travel will change markedly as North America reduces its dependence on China and China builds up its links with the Global South, which is cementing its power in the global trade map.
“Global trade is set to top $29 trillion by 2033, but the routes these goods will travel is changing at a remarkable pace,” Aparna Bharadwaj, managing director and partner at BCG, said in a release. “Trade lanes were already shifting from historical patterns and looming US tariffs will accelerate this. Navigating these new dynamics will be critical for any global business.”
To understand those changes, BCG modeled the direct impact of the 60/25/20 scenario (60% tariff on Chinese goods, a 25% on goods from Canada and Mexico, and a 20% on imports from all other countries). The results show that the tariffs would add $640 billion to the cost of importing goods from the top ten U.S. import nations, based on 2023 levels, unless alternative sources or suppliers are found.
In terms of product categories imported by the U.S., the greatest impact would be on imported auto parts and automotive vehicles, which would primarily affect trade with Mexico, the EU, and Japan. Consumer electronics, electrical machinery, and fashion goods would be most affected by higher tariffs on Chinese goods. Specifically, the report forecasts that a 60% tariff rate would add $61 billion to cost of importing consumer electronics products from China into the U.S.
That strategy is described by RILA President Brian Dodge in a document titled “2025 Retail Public Policy Agenda,” which begins by describing leading retailers as “dynamic and multifaceted businesses that begin on Main Street and stretch across the world to bring high value and affordable consumer goods to American families.”
RILA says its policy priorities support that membership in four ways:
Investing in people. Retail is for everyone; the place for a first job, 2nd chance, third act, or a side hustle – the retail workforce represents the American workforce.
Ensuring a safe, sustainable future. RILA is working with lawmakers to help shape policies that protect our customers and meet expectations regarding environmental concerns.
Leading in the community. Retail is more than a store; we are an integral part of the fabric of our communities.
“As Congress and the Trump administration move forward to adopt policies that reduce regulatory burdens, create economic growth, and bring value to American families, understanding how such policies will impact retailers and the communities we serve is imperative,” Dodge said. “RILA and its member companies look forward to collaborating with policymakers to provide industry-specific insights and data to help shape any policies under consideration.”
New Jersey is home to the most congested freight bottleneck in the country for the seventh straight year, according to research from the American Transportation Research Institute (ATRI), released today.
ATRI’s annual list of the Top 100 Truck Bottlenecks aims to highlight the nation’s most congested highways and help local, state, and federal governments target funding to areas most in need of relief. The data show ways to reduce chokepoints, lower emissions, and drive economic growth, according to the researchers.
The 2025 Top Truck Bottleneck List measures the level of truck-involved congestion at more than 325 locations on the national highway system. The analysis is based on an extensive database of freight truck GPS data and uses several customized software applications and analysis methods, along with terabytes of data from trucking operations, to produce a congestion impact ranking for each location. The bottleneck locations detailed in the latest ATRI list represent the top 100 congested locations, although ATRI continuously monitors more than 325 freight-critical locations, the group said.
For the seventh straight year, the intersection of I-95 and State Route 4 near the George Washington Bridge in Fort Lee, New Jersey, is the top freight bottleneck in the country. The remaining top 10 bottlenecks include: Chicago, I-294 at I-290/I-88; Houston, I-45 at I-69/US 59; Atlanta, I-285 at I-85 (North); Nashville: I-24/I-40 at I-440 (East); Atlanta: I-75 at I-285 (North); Los Angeles, SR 60 at SR 57; Cincinnati, I-71 at I-75; Houston, I-10 at I-45; and Atlanta, I-20 at I-285 (West).
ATRI’s analysis, which utilized data from 2024, found that traffic conditions continue to deteriorate from recent years, partly due to work zones resulting from increased infrastructure investment. Average rush hour truck speeds were 34.2 miles per hour (MPH), down 3% from the previous year. Among the top 10 locations, average rush hour truck speeds were 29.7 MPH.
In addition to squandering time and money, these delays also waste fuel—with trucks burning an estimated 6.4 billion gallons of diesel fuel and producing more than 65 million metric tons of additional carbon emissions while stuck in traffic jams, according to ATRI.
On a positive note, ATRI said its analysis helps quantify the value of infrastructure investment, pointing to improvements at Chicago’s Jane Byrne Interchange as an example. Once the number one truck bottleneck in the country for three years in a row, the recently constructed interchange saw rush hour truck speeds improve by nearly 25% after construction was completed, according to the report.
“Delays inflicted on truckers by congestion are the equivalent of 436,000 drivers sitting idle for an entire year,” ATRI President and COO Rebecca Brewster said in a statement announcing the findings. “These metrics are getting worse, but the good news is that states do not need to accept the status quo. Illinois was once home to the top bottleneck in the country, but following a sustained effort to expand capacity, the Jane Byrne Interchange in Chicago no longer ranks in the top 10. This data gives policymakers a road map to reduce chokepoints, lower emissions, and drive economic growth.”