The COVID-19 pandemic has had some far-reaching impacts on the U.S. supply chains for meat and poultry through the first half of 2020. In addition to short-term shutdowns of processing plants due to high coronavirus infection rates in the workforce, there has also been a shift in consumption away from restaurants and other out-of-home dining to in-home meal preparation through consumer retail channels.
Supply-side hot spots
According to historic data on supply and demand from IHS Markit’s Transearch database of freight traffic activity, counties that had high levels of COVID-19 infection in the local workforce through June process just under 50% of the nation’s supply of protein products. These products include fresh and frozen meat and poultry as well as meat and poultry products. Nearly 15 million tons, or 17% of the truck shipments of these food items, originate in a county where there has been at least one processing plant closure due to the pandemic. Over 25 million tons, or 30% of the trucked volume of these protein products, originate in a county that reported significant levels of COVID infections amongst workers in processing plants. Each of the top 30 meat-producing states have reported plant closures, and these disruptions have flowed through the supply chain into more than 30 consuming states. Significantly, as of the end of June, some of the key southern and western producing states were reporting record overall levels of infection.
It is, however, important to note that there does not seem to be any single comprehensive and detailed tabulation of the workforce virus infection rates and plant closings. Instead we used a wide variety of publicly available resources and published media reports to develop the information used in this analysis. While the federal government and some state agencies maintain some level of pertinent information, the available data lacks sufficient detail and coverage to support a highly detailed analysis. The extent of the disruptions may be higher than this analysis shows, due to the limitations of the available source data and continued new reports of disruptions that are still appearing frequently.
In the first half of the year, at least 240 meatpacking plants, including poultry, had temporary closures, with some facilities shut down more than once. Reports showed more than 25,000 workers who had tested positive, with around 100 deaths. These statistics indicate that the industry represented the third largest “organizational cluster” of infection, exceeded only by correctional facilities and nursing homes. The first reports of problems emerged in March, and the rate accelerated significantly in April and May. As the rate of meat processing plant disruption has abated, however, other types of food processing and farming locations have reported increasing levels of infection and closure, though not yet to the extent seen in this industry.
Production disruptions
There was significant variation by state on the potential impact from plant closings or production slowdowns caused by high worker infection rates. The greatest potential impact was in North Carolina, which produces 6 million tons of annual protein. Nearly 90% of the production in the state originated in counties with high worker infection rates. In Kansas, with just under 3 million tons of trucked shipments, almost 75% of that volume was potentially impacted. Other states where over half of the production was generated in counties with potential interruptions were Texas (over 6 million tons), Nebraska (over 4 million tons), and Minnesota (3.5 million tons).
States with significant production that have much lower levels of possible disruption were Virginia (over 2 million annual truck tons) and Alabama (over 3 million tons). Each of these states had just over 25% of their volume potentially affected. In Iowa (over 7 million tons) and Georgia (over 4 million tons), a little over one-third of the production was generated in impacted counties.
The cited tonnage figures are annual truck shipment volumes of fresh and frozen meat and poultry as well as meat and poultry products. The potential disruption was estimated based on plant closing and high infection rates in the producing counties and is only an indicator of where 2020 production may be impacted, not an estimation of the actual impact levels. This information only addresses shipment volumes and is not a commentary in any way about the potential effects of consumption of these products.
Demand disruptions
The IHS Markit Transearch data tracks annual shipment levels from producing counties to consuming counties. With this market-to-market flow perspective, the impact of production disruption is linked and traceable to the consuming markets. For the protein products under consideration in this analysis, a variety of consumption channels were included. The consuming markets represented the aggregate volume of meat and poultry as well as meat and poultry products that were shipped into consumer channels such as wholesalers, supermarkets, and other retailers. That volume also included industrial consumption by meat processing facilities that produce processed meat products such as sausages, hot dogs, and luncheon meats.
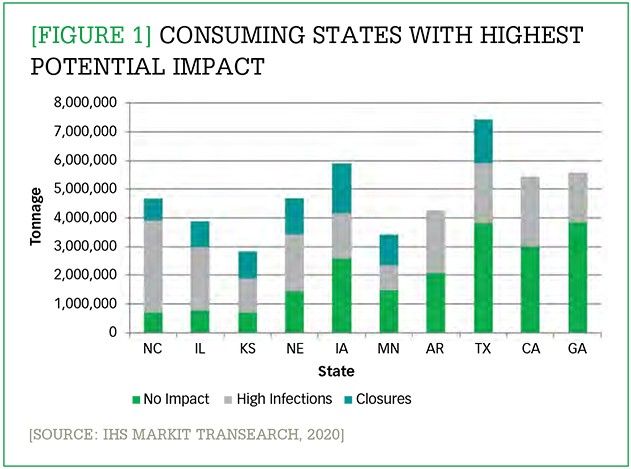
The major consuming states subject to the highest impacts of disruption were North Carolina, Illinois, and Kansas. In North Carolina, 85% of the 4 million annual inbound tons of truck shipments originated in affected counties. Illinois had 80% of the over 3 million inbound tons shipped by truck from disrupted origin counties, and Kansas showed 75% of the 2 million tons delivered from affected production points. Nebraska received over 3 million tons by truck annually, with 70% coming from affected markets. The analysis of the top consuming markets appears in Figure 1.
[Figure 1] Consuming states with highest potential impact Enlarge this image
As the COVID-19 pandemic continues to spread, particularly in some states with significant levels of meatpacking and processing facilities, forecasting the 2020 annual production volumes is extremely challenging. While the individual facility closings are typically of short duration to allow for thorough cleaning, the implementation of enhanced-safety worker protection measures also effects plant productivity levels and ultimately output volumes shipped. The already identifiable impacts of this disruption are spot shortages of certain meat products in some market areas and higher consumer prices.
There have also been changes in distribution patterns. Some major food service providers that previously supplied only institutional and restaurant markets are offering direct-to-consumer sales. For producers, however, the shift from commercial and institutional supply channels to retail and direct-to-consumer remains challenging, as there are different packaging and labeling requirements for each of these consuming sectors. There were also reports of trucks arriving for pickups or deliveries at processing plants, only to learn that the facility was closed.
Frequent communications between carriers and shippers/receivers is even more critical than normal. As the pandemic continues to spread in some market areas, maintaining frequent communications will continue to be crucial, as some shutdowns have and may well continue to occur on short notice.
Just 29% of supply chain organizations have the competitive characteristics they’ll need for future readiness, according to a Gartner survey released Tuesday. The survey focused on how organizations are preparing for future challenges and to keep their supply chains competitive.
Gartner surveyed 579 supply chain practitioners to determine the capabilities needed to manage the “future drivers of influence” on supply chains, which include artificial intelligence (AI) achievement and the ability to navigate new trade policies. According to the survey, the five competitive characteristics are: agility, resilience, regionalization, integrated ecosystems, and integrated enterprise strategy.
The survey analysis identified “leaders” among the respondents as supply chain organizations that have already developed at least three of the five competitive characteristics necessary to address the top five drivers of supply chain’s future.
Less than a third have met that threshold.
“Leaders shared a commitment to preparation through long-term, deliberate strategies, while non-leaders were more often focused on short-term priorities,” Pierfrancesco Manenti, vice president analyst in Gartner’s Supply Chain practice, said in a statement announcing the survey results.
“Most leaders have yet to invest in the most advanced technologies (e.g. real-time visibility, digital supply chain twin), but plan to do so in the next three-to-five years,” Manenti also said in the statement. “Leaders see technology as an enabler to their overall business strategies, while non-leaders more often invest in technology first, without having fully established their foundational capabilities.”
As part of the survey, respondents were asked to identify the future drivers of influence on supply chain performance over the next three to five years. The top five drivers are: achievement capability of AI (74%); the amount of new ESG regulations and trade policies being released (67%); geopolitical fight/transition for power (65%); control over data (62%); and talent scarcity (59%).
The analysis also identified four unique profiles of supply chain organizations, based on what their leaders deem as the most crucial capabilities for empowering their organizations over the next three to five years.
First, 54% of retailers are looking for ways to increase their financial recovery from returns. That’s because the cost to return a purchase averages 27% of the purchase price, which erases as much as 50% of the sales margin. But consumers have their own interests in mind: 76% of shoppers admit they’ve embellished or exaggerated the return reason to avoid a fee, a 39% increase from 2023 to 204.
Second, return experiences matter to consumers. A whopping 80% of shoppers stopped shopping at a retailer because of changes to the return policy—a 34% increase YoY.
Third, returns fraud and abuse is top-of-mind-for retailers, with wardrobing rising 38% in 2024. In fact, over two thirds (69%) of shoppers admit to wardrobing, which is the practice of buying an item for a specific reason or event and returning it after use. Shoppers also practice bracketing, or purchasing an item in a variety of colors or sizes and then returning all the unwanted options.
Fourth, returns come with a steep cost in terms of sustainability, with returns amounting to 8.4 billion pounds of landfill waste in 2023 alone.
“As returns have become an integral part of the shopper experience, retailers must balance meeting sky-high expectations with rising costs, environmental impact, and fraudulent behaviors,” Amena Ali, CEO of Optoro, said in the firm’s “2024 Returns Unwrapped” report. “By understanding shoppers’ behaviors and preferences around returns, retailers can create returns experiences that embrace their needs while driving deeper loyalty and protecting their bottom line.”
Facing an evolving supply chain landscape in 2025, companies are being forced to rethink their distribution strategies to cope with challenges like rising cost pressures, persistent labor shortages, and the complexities of managing SKU proliferation.
1. Optimize labor productivity and costs. Forward-thinking businesses are leveraging technology to get more done with fewer resources through approaches like slotting optimization, automation and robotics, and inventory visibility.
2. Maximize capacity with smart solutions. With e-commerce volumes rising, facilities need to handle more SKUs and orders without expanding their physical footprint. That can be achieved through high-density storage and dynamic throughput.
3. Streamline returns management. Returns are a growing challenge, thanks to the continued growth of e-commerce and the consumer practice of bracketing. Businesses can handle that with smarter reverse logistics processes like automated returns processing and reverse logistics visibility.
4. Accelerate order fulfillment with robotics. Robotic solutions are transforming the way orders are fulfilled, helping businesses meet customer expectations faster and more accurately than ever before by using autonomous mobile robots (AMRs and robotic picking.
5. Enhance end-of-line packaging. The final step in the supply chain is often the most visible to customers. So optimizing packaging processes can reduce costs, improve efficiency, and support sustainability goals through automated packaging systems and sustainability initiatives.
That clash has come as retailers have been hustling to adjust to pandemic swings like a renewed focus on e-commerce, then swiftly reimagining store experiences as foot traffic returned. But even as the dust settles from those changes, retailers are now facing renewed questions about how best to define their omnichannel strategy in a world where customers have increasing power and information.
The answer may come from a five-part strategy using integrated components to fortify omnichannel retail, EY said. The approach can unlock value and customer trust through great experiences, but only when implemented cohesively, not individually, EY warns.
The steps include:
1. Functional integration: Is your operating model and data infrastructure siloed between e-commerce and physical stores, or have you developed a cohesive unit centered around delivering seamless customer experience?
2. Customer insights: With consumer centricity at the heart of operations, are you analyzing all touch points to build a holistic view of preferences, behaviors, and buying patterns?
3. Next-generation inventory: Given the right customer insights, how are you utilizing advanced analytics to ensure inventory is optimized to meet demand precisely where and when it’s needed?
4. Distribution partnerships: Having ensured your customers find what they want where they want it, how are your distribution strategies adapting to deliver these choices to them swiftly and efficiently?
5. Real estate strategy: How is your real estate strategy interconnected with insights, inventory and distribution to enhance experience and maximize your footprint?
When approached cohesively, these efforts all build toward one overarching differentiator for retailers: a better customer experience that reaches from brand engagement and order placement through delivery and return, the EY study said. Amid continued volatility and an economy driven by complex customer demands, the retailers best set up to win are those that are striving to gain real-time visibility into stock levels, offer flexible fulfillment options and modernize merchandising through personalized and dynamic customer experiences.
Geopolitical rivalries, alliances, and aspirations are rewiring the global economy—and the imposition of new tariffs on foreign imports by the U.S. will accelerate that process, according to an analysis by Boston Consulting Group (BCG).
Without a broad increase in tariffs, world trade in goods will keep growing at an average of 2.9% annually for the next eight years, the firm forecasts in its report, “Great Powers, Geopolitics, and the Future of Trade.” But the routes goods travel will change markedly as North America reduces its dependence on China and China builds up its links with the Global South, which is cementing its power in the global trade map.
“Global trade is set to top $29 trillion by 2033, but the routes these goods will travel is changing at a remarkable pace,” Aparna Bharadwaj, managing director and partner at BCG, said in a release. “Trade lanes were already shifting from historical patterns and looming US tariffs will accelerate this. Navigating these new dynamics will be critical for any global business.”
To understand those changes, BCG modeled the direct impact of the 60/25/20 scenario (60% tariff on Chinese goods, a 25% on goods from Canada and Mexico, and a 20% on imports from all other countries). The results show that the tariffs would add $640 billion to the cost of importing goods from the top ten U.S. import nations, based on 2023 levels, unless alternative sources or suppliers are found.
In terms of product categories imported by the U.S., the greatest impact would be on imported auto parts and automotive vehicles, which would primarily affect trade with Mexico, the EU, and Japan. Consumer electronics, electrical machinery, and fashion goods would be most affected by higher tariffs on Chinese goods. Specifically, the report forecasts that a 60% tariff rate would add $61 billion to cost of importing consumer electronics products from China into the U.S.