


Whether it's on Wall Street or Fleet Street, investors take notice of companies that have effective supply chains. Manufacturers with well-run supply chains command a higher valuation because they have mastered the match between demand and supply for their product. Companies that have not achieved this alignment, on the other hand, experience delivery delays, quality issues, and excessively high inbound logistics costs, all of which have a negative effect on their financial performance. In short, successful supply chain management equates to the ability to create shareholder value.
One of the key factors for achieving effective supply chain management (and therefore financial success) is having the right "fit" between the demand aspects of a product and the design of its underlying supply chain. For example, innovative products with unpredictable demand are best served by a responsive supply chain that is able to meet quick turnaround times and make the most of short product lifecycles. Functional products with predictable levels of demand, by contrast, are best served by an efficient supply chain that focuses on minimizing costs.
![[Figure 1] Achieving a fit in the supply chain](/media-library/scq201004scfit-fig1.jpg?id=53612262)
![[Figure 2] Respondent work experience](/media-library/scq201004scfit-fig2.jpg?id=53612263)
![[Figure 3] Breakdown of respondent sample](/media-library/scq201004scfit-fig3.jpg?id=53612264)
![[Figure 4] Measure of research constructs](/media-library/scq201004scfit-fig4.jpg?id=53612265)
![[Figure 5] Selected companies with a high degree of supply chain fit](/media-library/scq201004scfit-fig5.jpg?id=53612266)
![[Figure 6] Market capitalization: supply chain fit vs. S&P 500](/media-library/scq201004scfit-fig6.jpg?id=53612267)
And yet, many companies still fail to adjust their supply chain strategies to match the underlying product.1 Granted, it's not easy. Most companies deliver a number of products in parallel, which complicates the alignment of supply chains with product portfolios. Additionally, companies must continually reformulate their supply chain fit as they adopt new product lines, enter new markets, build new warehouses and production plants, and lose the protection of traditional industry barriers.
It makes sense, then, that achieving supply chain fit would have a positive impact on a company's financial position. To test this hypothesis and determine to what degree supply chain fit affects financial success, we surveyed the largest manufacturing companies in the United States and Europe. Our financial analysis of 259 U.S. and European manufacturers shows that those companies demonstrating a good supply chain fit have a market capitalization (or the total market value of all of a company's outstanding shares) that is approximately 19 percent higher than that of counterparts that do not have a good supply chain fit. This article explores that critical link between supply chain fit and corporate performance in terms of market capitalization. Specifically, we demonstrate how companies that have achieved a supply chain fit outperform Standard & Poor's S&P 500 index, an index of stock performance of 500 leading U.S. companies in a number of industries.
Do you have a good fit?
Our concept of supply chain fit is based on a framework developed by Marshall Fisher in his seminal 1997 Harvard Business Review article, "What is the right supply chain for your product?" and further developed by Sunil Chopra and Peter Meindl in their book Supply Chain Management: Strategy, Planning, and Operation.
Top companies achieve supply chain fit by understanding the demand aspects of their products, building a supply chain with the capabilities needed to satisfy its targeted customer segments, and aligning the supply chain strategy to the overall competitive strategy of the company. To achieve supply chain fit, then, supply chain managers must take the following steps:
1. Understand the product's demand and supply uncertainty levels. To devise the right supply chain strategy for a product, you must first understand where it lies on the "uncertainty spectrum"—in other words, how unpredictable demand and supply for that product is. Is it a functional product with a predictable level of demand, an innovative product with unpredictable demand, or something in between?
It is important to understand customers' needs for each targeted segment and the uncertainty that the supply chain faces in satisfying those needs. Next, combine demand and supply uncertainty for the underlying product and map the results on the implied uncertainty spectrum. This helps to identify the level of demand unpredictability, disruption, and delay that the supply chain must be prepared to handle. (The implied uncertainty spectrum is shown along the x-axis in Figure 1.)
2. Assess your supply chain capabilities. Assess what type of supply chain you have: Is it a responsive supply chain or an efficient supply chain? A highly responsive supply chain is able to create innovative products, handle large varieties of products, fill a wide range of product quantities, and meet requests for very tight lead times and high service levels.
Unfortunately, responsiveness is not free. For every strategic choice to increase responsiveness, additional costs are incurred and efficiency declines. A more efficient supply chain, on the other hand, would focus on ways to cut costs in the supply chain at the expense of some responsiveness. (The responsiveness spectrum is shown along the y-axis in Figure 1.)
3. Match the level of responsiveness to the level of uncertainty. Next, you need to ensure that the degree of supply chain responsiveness is consistent with the implied uncertainty level. The goal is high responsiveness for a supply chain facing high implied uncertainty and efficiency for a supply chain facing low implied uncertainty,2 as shown in Figure 1.
By achieving supply chain fit, a company ensures that its supply chain strategy is sufficiently linked to its overall competitive strategy and that its supply chain capabilities help it satisfy the company's target customers. Any misalignment between strategic vision (or the strategy for a product) and execution (or the strategy for the product's supply chain) presents a significant improvement opportunity for a company.
To succeed, however, companies will need to develop a new set of strategic managerial competencies. Managers must be able to view the company holistically with a thorough understanding of the linkages among functions. This will not be easy; in many companies, different departments devise different competitive and functional strategies. Without proper information sharing between departments and coordination by executives, companies are not likely to achieve supply chain fit.
Calculating supply chain fit
To find out whether achieving supply chain fit affected a company's financial position, we contacted 1,834 supply chain, logistics, and purchasing executives at the 1,000 largest manufacturing companies in the United States, the United Kingdom, Germany, Austria, Switzerland, and France. We received 259 responses. The respondents have a very good knowledge of their companies' main product lines, supply chain structure, and supplier base. On average, they have worked in the fields of procurement, logistics, supply chain, production, or related fields for 13.2 years. They have held their current positions for 3.9 years and have worked for their current employers for 9.9 years. Figure 2 summarizes the respondents' characteristics. (For a more detailed breakdown of respondents by title, function, company size, and industry sector, see Figure 3.)
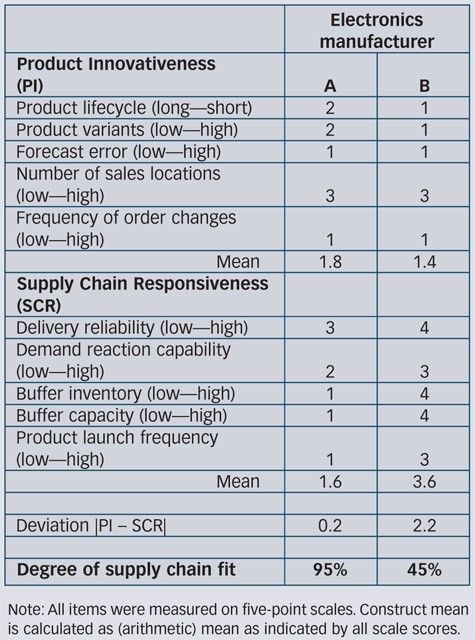
We asked respondents a series of questions that helped them assign their companies a score for product innovativeness (demand uncertainty) and a score for supply chain responsiveness. Product innovativeness was measured in terms of product lifecycle; number of available variants; average forecast error; number of sales locations; and frequency of order changes in terms of content, size, delivery time, or other patterns. As outlined in Figure 4, supply chain responsiveness was measured in terms of delivery reliability, buffer inventory of parts or finished goods, buffer capacity in manufacturing, quick response to unpredictable demand, and frequency of new product introductions.3
Companies achieve a high degree of fit when the degree of supply chain responsiveness matches the degree of product innovativeness. Supply chain fit can therefore be calculated by measuring the difference between those two factors. Accordingly, we computed a supply chain fit (SCF) index for each company as follows:
SCF = |PI - SCR|
where PI is the standardized score for product innovativeness (the degree of demand uncertainty for the product) and SCR is the standardized score for supply chain responsiveness. The ideal supply chain fit score would be 0, indicating that the supply chain responsiveness exactly fit the level of product innovativeness (demand uncertainty). Any deviation from zero indicates the degree of misfit.4 (For a simplified example of the computation for two similar companies, see the above sidebar "A sample fit assessment.")
Impact of supply chain fit
To differentiate between companies with and without a supply chain fit, the data sample was split into two groups: "supply chain fit companies," whose supply chains meet their products' requirements, and "supply chain misfit companies," whose supply chains do not meet their products' requirements. Supply chain fit companies comprised all cases with +/- one standard deviation (0.61) around the arithmetic mean (N = 163). Supply chain misfit companies constituted the remaining cases (N = 96). Figure 5 includes a list of the 10 companies from our survey with the best supply chain fit.
In order to investigate the financial impact of supply chain fit, we analyzed whether the 163 companies with a supply chain fit outperformed the S&P 500 Index. We developed a market-capitalization index consisting of daily share prices of supply chain fit companies, and then measured it against the S&P 500 Index between Quarter 1 of 2005 and Quarter 4 of 2008. Our results indicate that market capitalization of supply chain fit companies outperforms the S&P 500 Index on average by 18.9 percent—and by as much as 44.5 percent (see Figure 6).
This finding fits very well with previous research,5 which indicated that companies that adapt their supply chains to the demand aspects of their products achieve superior profitability—up to 100-percent higher profits in terms of sales growth, earnings before interest and tax (EBIT) margins, return on assets (ROA), and return on capital employed (ROCE).
A call to action
This research shows that the impact of supply chain management on a company's financial success is much greater than classic logistics key performance indicators (KPIs) may suggest. A well-run supply chain helps companies to not only reduce costs but also to improve profitability. Indeed, the concept of supply chain fit can be used to identify key supply chain metrics that tie directly to the three key components of economic value added (EVA)—revenue, costs, and assets. As a consequence, the concept of supply chain fit can also be used to show how supply chain initiatives can help improve a company's market capitalization.
Despite the clear benefits of achieving supply chain fit, 37 percent of companies have not yet achieved that goal. Many companies, therefore, have a significant opportunity to boost their financial performance by improving their supply chain fit.
There are several important steps companies can take to move in that direction. First, supply chain management should be represented in the highest echelons of management. This will help to ensure that corporate management understands how supply chain performance impacts market capitalization. Second, everyone who is responsible for managing supply chain activities must be aware of the company's financial performance metrics, so that decisions made at the operational level are tied to expected outcomes. Third, executives have to understand how supply chain fit is achieved, maintained, and continuously adapted. And finally, a process must be established to educate those in operational roles on the impact of their daily actions on the company's overall performance.
It's important to bear in mind, however, that supply chain fit is a dynamic concept. Because customer preferences—and thus the demand aspects of products—are always in flux, any supply chain fit can only be temporary. Therefore, a manufacturing company must always be adapting and aligning its competitive strategy (and resulting implied uncertainty) and supply chain strategy (and resulting responsiveness) as closely as possible.
Endnotes:
1. See, for example, D. Li and C. O'Brien, "A quantitative analysis of relationships between product types and supply chain strategies," International Journal of Production Economics, vol. 73, no. 1 (2001): pp. 29-39; G.N. Stock, N.P. Greis, and J.D. Kasarda, "Enterprise logistics and supply chain structure: The role of fit," Journal of Operations Management, vol. 18, no. 5 (2000): pp. 531-547; and D.H. Doty, W.H. Glick, and G.P. Huber, "Fit, equifinality, and organizational effectiveness: A test of two configurational theories," Academy of Management Journal, vol. 36, no. 6 (1993): pp. 1196-1250.
2. S. Chopra and P. Meindl, Supply Chain Management—Strategy, Planning, and Operation, 4th edition, (Upper Saddle River, New Jersey: Pearson Education, 2010).
3. The criteria that we used to assess innovativeness and supply chain responsiveness are suggested by Marshall Fisher in his Harvard Business Review article, "What is the right supply chain for your product?" Vol. 75, no. 2 (1997): pp. 105-116.
4. Similar "fit" procedures have been applied in the literature. For example, see C. Gresov, "Exploring fit and misfit with multiple contingencies," Administrative Science Quarterly, vol. 34, no. 3 (1989): pp. 431-453; N. Venkatraman and J.E. Prescott, "Environment-strategy coalignment: An empirical test of its performance implications," Strategic Management Journal, vol. 11, no. 1 (1990): pp. 1-23; J.A. Siguaw, G. Brown, and R.E. Widing II, "The influence of market orientation of the firm on sales force behavior and attitudes," Journal of Marketing Research, vol. 31, no. 1 (1994): pp. 106-116; and D. Miller, "Stale in the saddle: CEO tenure and the match between organization and environment," Management Science, vol. 37, no. 1 (1991): pp. 34-52.
5. P.T. Grosse-Ruyken, S.M. Wagner, and F. Erhun, "The bottom line impact of supply chain management: The impact of a fit in the supply chain on a firm's financial success," working paper, Zurich: Swiss Federal Institute of Technology Zurich, 2009.


