


At this time last year, firms were scrambling to figure out how to store inventory that could no longer be sold due to COVID lockdowns. Now the New York Times is writing articles titled “How the World Ran out of Everything,”1 as we deal with shortages ranging from fireworks2 to semiconductors.3
When I wrote the inventory update for Supply Chain Quarterly’s 2020 State of Logistics issue, I reported that the retail inventory-to-sales ratio for April 2020 was 1.67, one of its highest readings ever and the highest since 1995. One year later, the inventory-to-sales ratio comes in at 1.07—the lowest reading ever by some distance. While it may not sound like it, the movement of 0.6 points is the largest one-year movement in the history of this index. However, this does not mean that inventory is lower; it is actually the opposite, as overall levels are up by 1.3% from the same time last year (and up 4.7% from their nadir in July).
The difference lies in retail sales being 48.1% higher in April 2021 compared to April 2020 due to the reopening of the economy and the ending of COVID lockdowns. Retail sales have climbed every month since April, putting even more pressure on inventories. This trend helps to explain the ongoing shortages, delivery delays, and price spikes being reported across multiple industries. Many businesses have gone from standing still at this time a year ago to sprinting as quickly as they can in order to keep up with burgeoning consumer demand.
Side effects of pent-up demand
This shift has been largely driven by pent-up demand from U.S. consumers as they emerge from pandemic shutdowns. The U.S. economy grew at a rate of 6.4% in Q1 2021, and economists expect consumer spending could be up 9% this year—the highest increase since 1946—the year after the end of World War II. Savings were at 12.4% in May 2021, nearly 50% higher than the 8.3% registered in February 2020 before the lockdowns.4 The excitement over this rapid recovery has been somewhat tempered by fears of inflation, as consumer prices were up 5% for the 12-month period ending in May—the sharpest increase since 2008.5
These costs can be largely explained by the pressure that the sudden shutdown and rapid recovery has placed on the logistics industry. The Logistics Managers’ Index (LMI) measures the growth/contraction of key logistics metrics on a monthly basis (see Figure 1). The month-to-month movement for inventory levels (yellow line), inventory costs (purple line), available warehouse capacity (blue line), warehouse prices (green line), transportation capacity (gray line), and transportation costs (red line) are presented in the figure. When interpreting this figure, any value over 50.0 (represented by the dashed, black line) indicates month-to-month growth, and any value below 50.0 indicates contraction.
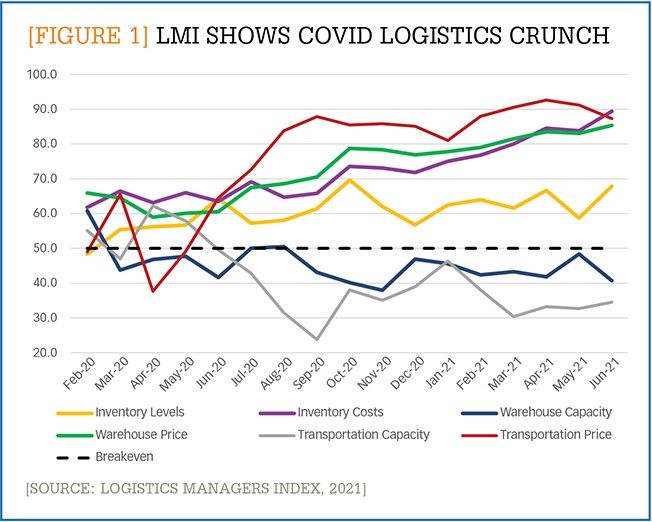
[Figure 1] LMI shows COVID logistics crunch
Enlarge this image
At the outset of COVID-19 (February 2020), inventory levels were down slightly (as they often are post-Q4), and inventory costs, warehouse capacity, and warehouse prices were all growing at moderate rates. As with most other things, the COVID-related lockdowns flipped these metrics on their heads. Inventory costs have increased considerably over the last 15 months. Interestingly, inventory levels have grown fairly steadily, eschewing the sharp growth or contraction patterns seen with every other metric in the figure. This moderate rate of inventory growth combined with the sharp growth of logistics costs and shift in inventory-to-sales ratios suggest that a volume of inventory is moving through supply chains at a high velocity. Evidence of the velocity is present in the secondary (or aftermarket) market, which was up $40 billion in 2020 to an all-time record of $671 billion—equivalent to 3% of U.S. gross domestic product (GDP).
This velocity is also reflected in the tightening capacity and rising costs presented in the figure. In the history of the LMI, warehouse capacity had never registered as contracting until March 2020. Since then, it has only registered growth once, in August 2020. Transportation capacity, after a brief spike in Spring 2020 during the height of lockdowns, has also contracted for the last year of readings. This lack of available capacity has led to a spike in logistics costs, with transportation prices above 80.0 on the index for a full year and both inventory and warehouse costs setting all-time index highs multiple times over the last year, including in June 2021.
The high costs of warehousing and transportation are relevant here because they directly impact the ability of firms to maintain a constant level of supply and meet customer demand. The lack of available transportation has impacted both international and domestic supply. There are stories of some low-margin items being pushed back to later sailings multiple times due to a lack of ocean shipping capacity. In some cases, this has doubled or tripled lead times for international shipping and increased the costs by a factor of 10. Demand for international shipping has led to the Port of Los Angeles setting an all-time record for imports for the year ending on June 30, exceeding 10 million TEUs (twenty-foot equivalent units) for the first time ever.6 This record-breaking volume has led to well-documented delays at the ports, with ships waiting weeks to be unloaded instead of days.
A similar capacity crunch exists domestically. The benchmarking and analytics company FreightWaves’ Tender Rejection Index, which tracks how many potential truckloads (tenders) are being rejected, has hovered around 25% since Fall 2020. This figure indicates that for every four loads that need to be moved, only three are being picked up. Rejected tenders have led to further shipping delays as well as spot rates increasing 67% for dry vans and 63% for flatbeds year-over-year. As a result of all these delays, firms have had a tough time managing inventory levels. Instead of getting a consistent stream of just-in-time (JIT) inventory flowing in at a level they can handle, inventory arrives in waves with nothing coming in for weeks and then big spikes suddenly overwhelming capacity.7
Digging out of this hole will take time. When asked to predict logistics activity over the next 12 months, LMI respondents predicted high levels of growth for warehouse and inventory costs, as well as overall inventory levels. (See Figure 2.)
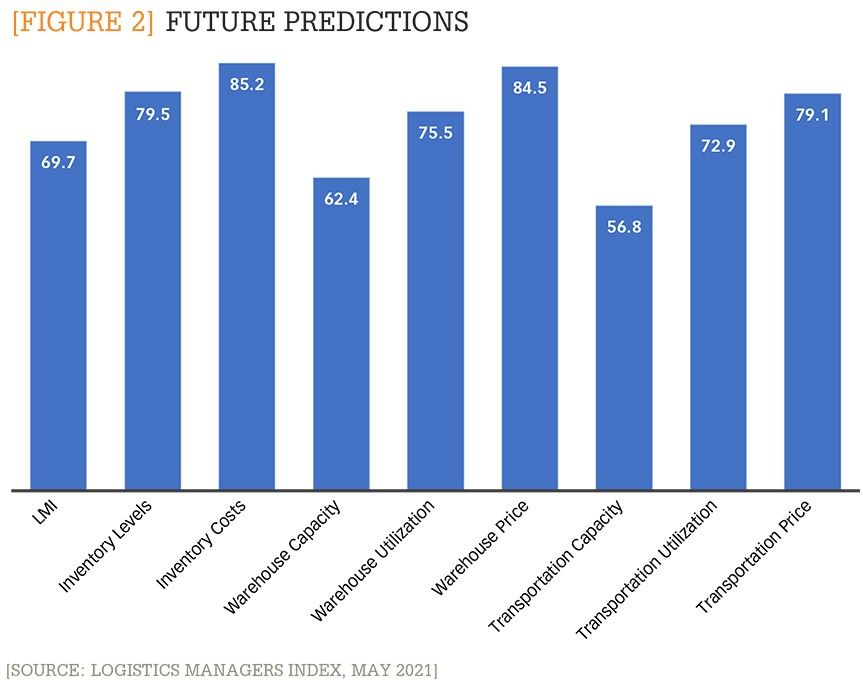
[Figure 2] Future predictions
Enlarge this image
Fortunately, there is some hope on the horizon, as respondents also predict growth in both available warehouse and transportation capacity over the next year. The levels of predicted growth are moderate, but they would be a relief after the last 15 months of contraction in available logistics capacity. This hope is further bolstered by the fact that LMI respondents have predicted future movements for the index with approximately 90% accuracy.
Post-pandemic strategies
Firms have gone through an unprecedented year. After the screeching halt to business as usual in 2020 and the fast restart of the economy, it is interesting to observe the different strategies firms are using to manage their inventory. For instance, some firms have moved away from long-held JIT strategies, even in industries that are JIT stalwarts, such as automotive and grocery. Grocery stores began stocking “pandemic pallets” of essential nonperishable items last year to deal with panic-buying associated with the various waves of viral outbreaks. Auto manufacturers have engaged in stock-piling and forward-buying as a way to avoid the disruptions that plagued them over the last year. Toyota outsold General Motors in the U.S. for the first time in Q2 2021 largely because they had a ready reserve of semiconductors, which allowed them to produce more vehicles.8 Of course, there can be downsides to this approach. In classic bullwhip fashion, there is now a glut of items like toilet paper and hand sanitizer that were overproduced to meet last year’s shortages.
It seems clear from the most recent indicators that consumers will not forget the lessons of the pandemic. It is important that firms do not forget these lessons either. Supply managers have always struggled to balance potential inventory shortages with overstocks. That has been even more difficult this year due to the wild fluctuations in demand. However, it has not been impossible. Many firms have reported some of their best years ever, despite the uncertain times. The companies that have been most successful over the last year are the ones with more resilient supply networks that have allowed them to adapt more quickly.
The emergence of the Delta variant epitomizes the cycle of disruptions that supply chains will always have to deal with. The firms that are the most flexible and can most deftly manage their inventory will be in the best position to deal with them.
Author’s note:For more insights like those presented above, see the LMI reports posted the first Tuesday of every month at: www.the-lmi.com.
Notes:
1. P.S. Goodman and N. Chokshi, “How the World Ran Out of Everything,” The New York Times (June 1, 2021): https://www.nytimes.com/2021/06/01/business/coronavirus-global-shortages.html
2. A. Huguelet, “Here’s why fireworks will be more expensive this year in the St. Louis area,” STLtoday (June 22, 2021): https://www.stltoday.com/news/local/metro/heres-why-fireworks-will-be-more-expensive-this-year-in-the-st-louis-area/article_c32b7afa-37d4-5f87-ada3-704c6bae19b6.html
3. S. McLain, “Auto Makers Retreat From 50 Years of ‘Just in Time’ Manufacturing,” Wall Street Journal (May 3, 2021): https://www.wsj.com/articles/auto-makers-retreat-from-50-years-of-just-in-time-manufacturing-11620051251
4. S.C. Cambon, “Consumer Spending Is Primed to Fuel Summer Growth,” Wall Street Journal (June 25, 2021): https://www.wsj.com/articles/consumer-spending-personal-income-inflation-may-2021-11624563378
5. Bureau of Labor Statistics, Bureau of Labor Statistics Data, Databases, Tables & Calculators by Subject (June 23, 2021): https://data.bls.gov/timeseries/CUSR0000SA0&output_view=pct_1mth
6. The Port of Los Angeles, “Port of Los Angeles Surpasses 1 Million Container Units in Single Month,” (June 15, 2021): https://www.portoflosangeles.org/references/news_061521_onemillionteu
7. S. Horsley, “Cargo Is Piling Up Everywhere, And It’s Making Inflation Worse,” NPR (June 21, 2021): https://www.npr.org/2021/06/21/1007938067/cargo-is-piling-up-everywhere-and-its-making-inflation-worse
8.8. S. McLain, “Toyota’s Chip Supply Helps It Beat General Motors for the First Time.” Wall Street Journal (July 6, 2021): https://www.wsj.com/articles/toyotas-chip-supply-helps-it-beat-general-motors-for-the-first-time-11625569943


