


Throughout the pandemic and its aftermath, warehousing has proven to be a remarkably resilient sector, to say the least. During the first quarter of 2021 alone, net absorption1 of the warehousing industry reached 80 million square feet, up over 50% from the previous year. This pace should translate into another record year of warehouse leasing activity, topping 600 million square feet, which was reached in last year’s record run despite economic uncertainties due to COVID.
Real estate developer clients of ours that have been in the logistics industry for decades are all telling me that they’ve never seen demand for warehousing space like they are today. They are all building new warehouse space as fast as they can, but it's been a struggle to keep pace with what seems like insatiable demand.
The key driver of this robust demand is the boom in online shopping, which has skyrocketed during the pandemic. Leading e-commerce players are recording over-the-top sales. Amazon in early 2021 reported its highest ever quarterly sales, surpassing $100 billion. Walmart’s online business was up almost 80% in its recent quarter, while Target saw its e-commerce volume surge by 154% during the same period.
U.S. markets leading the pack with new warehouse construction include: California’s Inland Empire; Houston, Texas; Atlanta, Georgia; Dallas, Texas; Chicago, Illinois; Central New Jersey; Milwaukee, Wisconsin; Detroit, Michigan; Phoenix, Arizona; and Columbus, Ohio. A high-growth sector that we are seeing in some of the country’s largest consumer markets—like New York; San Francisco, California; and Miami, Florida—is multi-story warehouses in urban settings that can provide quick and efficient last-mile deliveries. The rise of e-commerce and same-day delivery is ramping up demand for these urban warehouses, many in the food sector, as consumers are coming to expect faster and faster deliveries and are willing to pay for them.
Tight market conditions and strong demand are translating into sizeable warehouse rent hikes throughout the country. Year-over-year increases average about 4.9%, bringing the national average rental rate to about $6.35 per square feet, a new record high per our BizCosts.com database. Warehouse markets recording some of the highest asking rental rates include: San Francisco/North Bay, California, $14.97; Orange County, California, $13.94; Long Island, New York, $12.53; Los Angeles, California, $12.24; San Diego, California, $11.42; Central New Jersey, $10.72; East Puget Sound, Washington, $10.59; and Austin, Texas, $10.47.
Some of the tightest U.S. warehouse markets are Orange County, California; Los Angeles, California; Philadelphia, Pennsylvania; Central New Jersey; Nashville, Tennessee; Boise, Idaho; Hampton Roads, Virginia; Reno, Nevada; and Tulsa, Oklahoma—all of which are showing vacancy rates under 3%.
Costs carry the day
Comparative operating costs are playing an increasingly important role in deciding where to locate a distribution facility given the strains on the overall economy brought about by the pandemic. Higher corporate income taxes and the stiffer regulatory climate that is likely under the new Biden administration are also contributing to this focus on comparative costs.
The comparative cost of operating a warehouse in terms of labor, land, construction, power, and taxes can vary dramatically. Figure 1 compares the cost of operating a 500,000-square-foot distribution warehouse employing 150 workers. Annual operating costs range from a high of $18.3 million in the Meadowlands of Northern New Jersey to a low of $13.5 million in Ritzville, Washington—a differential of over 26%.
The costs shown for the surveyed locations in Figure 1 are consistent with site selection trends that show clients favoring cities with linkages to the global marketplace via deep-water ports and intermodal services. Each year, the U.S. moves more than $24 trillion in goods weighing over 19 billion tons between countless domestic and international points. An increasing percentage of these shipments are being made through our nation’s ports and intermodal facilities.
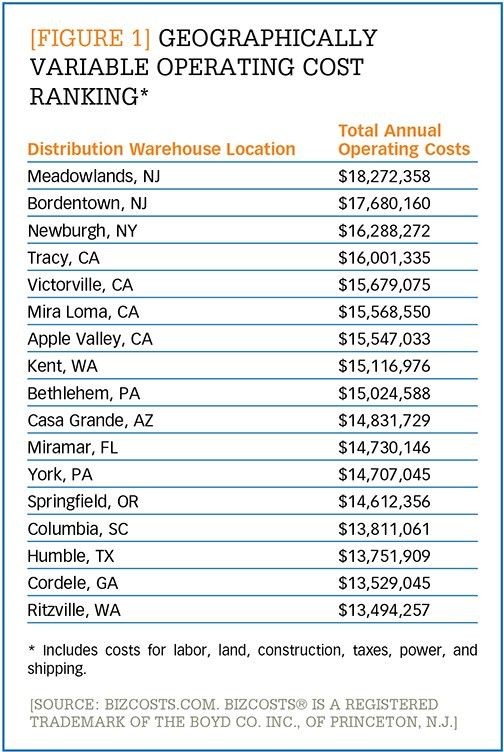
[Figure 1] Geographically variable operating cost ranking
Enlarge this image
A new site-selection driver
For years, our firm has been saying that corporate site selection is both a science and an art. The “science” deals with the numbers, the quantitative analysis of operating costs, taxes, incentives, and other geographically variable factors that we can attach a dollar sign to.
The “art” of site selection relates to those more qualitative factors that vary by city, such as housing, education, and cultural and recreational amenities. These factors impact a company’s ability to retain key people in the initial move and to be in a strong recruiting position to attract top talent from both local and national labor markets in the years ahead.
That said, we are now dealing with a new site-selection variable on the qualitative side of the ledger: ESG (environmental, social, and governance) ranking. Beyond site-selection implications, investors in real estate—including major real estate investment trusts (REITs) that are heavily focused on warehousing—are increasingly applying ESG factors as part of their investment decisions.
A good example of ESG factoring into warehouse site selection, especially for power-hungry cold chain warehouses, is a current project of ours in Washington. Part of the draw of that state is that 70% of its power is generated by sustainable Columbia River hydro, solar, and wind power. Ritzville, located on Interstate 90 in eastern Washington, is home to the massive, new Adams-Nielson Solar Power Generation Plant. The facility, 25 times larger than any other solar farm in the state, was built to supply power to as many as 80 large warehousing and manufacturing customers wanting carbon-free, green electricity.
2021 speed bumps
While the warehousing sector is booming and is dominating our firm’s corporate site selection workload, it is not without speed bumps that are likely to persist into next year at least. Here are three of those speed bumps that need to be navigated:
1. Material shortages and rising prices. Wide-scale shortages of critical building materials, soaring commodity prices, and supply chain bottlenecks are all causing extended lead times and inflationary cost pressures for our warehousing site selection clients. Timing delays on raw materials—principally steel—are generating strong headwinds on the pace of new warehousing construction. Supply chain interruptions brought about by the pandemic are also driving up commodity prices. Look for warehouse construction materials as diverse as steel, lumber, drywall, copper, microchips, and aluminum to cost 10% to 25% more. Lumber prices alone are up 29% from last year.
Also contributing to supply shortages and rising costs are heavily backlogged West Coast ports and higher over-the-road freight costs, with truckload van rates now averaging $2.68 per mile nationally and as high as $2.81 in the Midwest region.
2. Labor shortages. Companies throughout the U.S. are struggling to find workers, and no industry is struggling harder than warehousing. Finding workers has been a challenge for a number of reasons, including the federal government’s extended unemployment insurance benefits, continuing apprehension of contracting COVID-19, and the need for some employees to care for their remote-schooled children.
These hiring difficulties have prompted our site-seeking warehouse clients to offer wage hikes and more generous benefit packages in order to better compete for workers in one of the tightest and most challenging labor markets that we have seen in years. The pace of client investments in robotics and automation techniques are also on the rise due to the worker shortage.
Compounding the hiring difficulties is the fact that warehouses tend to cluster in certain cities and in certain industrial parks, given their common need for zoning; major highway and/or rail access; and level, buildable, and affordable real estate. As a result, warehouses often compete against each other for the same labor.
3. Re-emergence of NIMBY (“not in my backyard”). Warehouse development has been having a sustained and unprecedented boom. As a result, the next boom we may see is an increase in regulation, spurred by anti-growth critics and watch dogs of the industry.
In trend-setting California, the governing board of the South Coast Air Quality Management District—the air pollution control agency for major portions of Los Angeles, Orange, San Bernardino, and Riverside counties—has adopted new regulations targeting warehouses of 100,000 square feet or more. These facilities must directly reduce nitrogen oxide (NOx) and diesel particulate matter (PM) emissions or pay a mitigation fee.
Similarly, many communities are also showing resistance to the construction of new warehouses. San Bernardino, California, situated in the epicenter of the vast Inland Empire warehousing market, was a single vote shy of establishing a 45-day moratorium on the construction of all new warehouses. Up until its May 2021 vote, San Bernardino had processed and approved 26 warehouse projects since 2015, covering 9.6 million square feet. Neighboring Inland Empire city, Colton, already has imposed a 45-day moratorium on new warehouses, with consideration to extend it another 10 months.
Nor is this type of pushback limited to the “Left Coast.” In the major warehousing hub of Chicago, a newly formed group, South Suburbs for Greenspace over Concrete, generated community opposition against warehouse development on the former Calumet County Club property. On the East Coast, opponents of two new warehouses planned for Robbinsville in Central New Jersey filed a lawsuit against the township’s approval of the project, saying the public was not given enough time to comment and that the decision was “tainted” by its reliance on flawed studies and out-of-date information.
Look for these speed bumps to emerge in other cities around the country, especially in those mature warehouse hubs with progressive leaders at the helm. At minimum, expect more changes to city codes that will elevate the standards against which municipalities evaluate and approve new warehouse projects moving forward.
Notes:
1. Net absorption is the sum of the square feet that became physically occupied for a period minus the sum of the square feet that became physically vacant.


