


As one of the oldest “heavy” industries in the United States, railroads have been at the vanguard of how the private sector and government interface. The Interstate Commerce Act of 1887 created the Interstate Commerce Commission (ICC) to regulate railroads as common carriers by eliminating rate discrimination and ensuring fair rates. The legislation, which arose from public outcry against perceived monopolistic practices, specifically demanded that railroad rates be “reasonable and just.”1
This regulatory regime remained in place until the deregulation initiatives of the late 1970s. The Staggers Rail Act of 1980 reduced the ICC’s authority by allowing railroads to set rates more freely and become more competitive with the trucking industry. Congress abolished the ICC in 1995, and many of its remaining functions were transferred to a new agency, the Surface Transportation Board (STB).
Most of the STB’s impact has been in the area of its review of railroad mergers. However, this function has been mostly dormant since the agency turned down the proposed BNSF-Canadian National (CN) merger in 2001. Nonetheless, this responsibility is back in public view with the proposed acquisition of Kansas City Southern (KCS) by both CN and Canadian Pacific Railway (CP).
The history of regulating railroad mergers in the U.S. is fraught. Following rail deregulation in 1980, the ICC oversaw a rapid series of end-to-end mergers. After the ICC was “sunset” in 1995, the STB approved a series of ever larger and more disastrous railroad mergers.
Those mergers led to horrendous rail-service meltdowns. In the face of rising shipper opprobrium, the STB and the rail industry reached agreement on publishing a very limited set of service metrics. As shown in Figure 1, most of the STB’s current metrics apply to traditional carload service, and only a few specifically or meaningfully apply to intermodal. Yet intermodal is increasingly important: Not only does this segment represent half of all U.S. rail volume today (Figure 2), but it also is growing, while other commodities, especially coal, are declining.
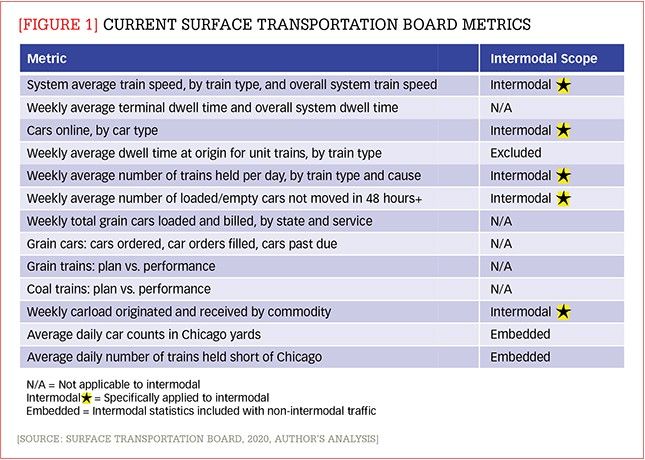
[Figure 1] Current Surface Transportation Board metrics
Enlarge this image
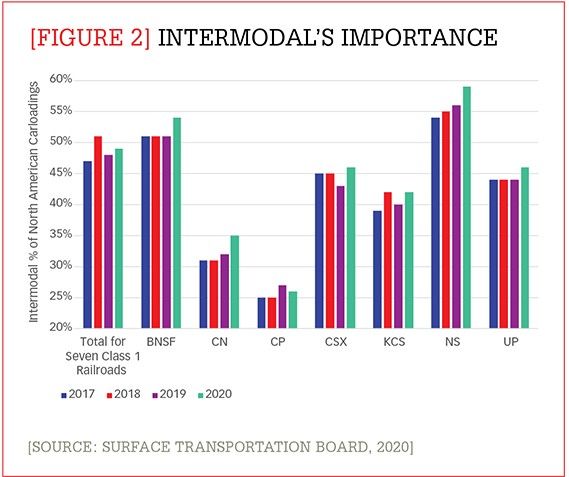
[Figure 2] Intermodal's importance
Enlarge this image
There are several problems with the current metrics. For one thing, two of the major intermodal metrics, intermodal train speed and intermodal cars on a railroad, are distinctions without differences. The standard deviations just are not statistically significant, nor are they necessarily correlated to service.2 For another, the STB’s measure of “trains holding” and “cars not moving in 48+ hours” are essentially numbers without context, because each railroad’s results differ widely from the others due to differences in geography, traffic mix, and operating parameters.
Finally, consider that intermodal service—like its competitor over-the-road trucking—is about door-to-door transportation. In the standard intermodal sequence (Figure 3) there are many different pieces that “make intermodal look like truck,” from the time a box is picked up until it is delivered. But the current STB data focuses solely on a broad, high-level assessment of rail activity. The components highlighted in orange in Figure 3 are the critical pieces of intermodal service that go unmeasured today. Most are terminal-related, involving either the intermodal ramp or train-to-train connectivity. These and other metrics I propose the STB adopt are discussed below.
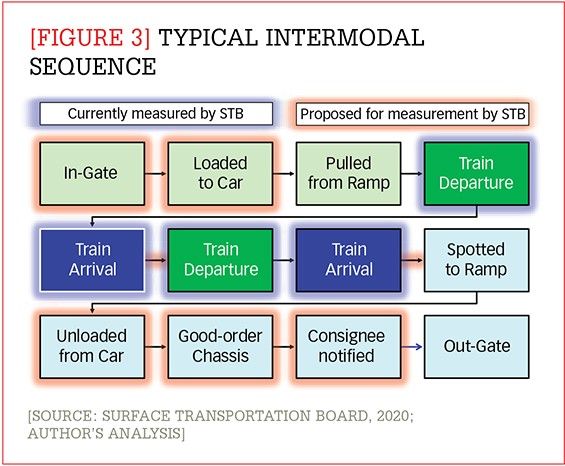
[Figure 3] Typical intermodal sequence
Enlarge this image
Think about the current metrics in terms of passenger flight. On-time performance does not matter if the first flight in a series is delayed; a missed connection requires rescheduling of all subsequent segments. The same applies in intermodal transportation. Analysis of train performance must always consider the possible existence of connecting legs. It also does not matter that the flight departure or arrival times were correct if you sat for three hours waiting to deplane. Schedule compliance only matters if all legs perform on time.
In other words, any assessment of intermodal service reliability is only meaningful when measured end-to-end. It is about the overall trip, not the segments. Returning to the air travel analogy, you do not care how fast an airline’s planes were flying, how many planes are parked, or how many planes are in the airline’s fleet. Trip-plan compliance is essential. Other metrics are extraneous or meaningless.
The entire intermodal system currently finds itself in gridlock, with no clear measurements as to how and why this occurred. It is time for the STB to ensure that stakeholders are provided with meaningful, transparent, and granular metrics.
Rather than continual acquiescence to what railroads are willing to provide, the STB needs to mandate that they provide the information the public requires. This means comprehensively addressing the entire intermodal itinerary, not just portions of the rail linehaul.
The following describes five areas that are not currently being measured. I believe they should be, and I propose a set of metrics and key performance indicators (KPIs) for each (summarized in Figure 4), with a brief description of some associated issues or considerations to keep in mind.
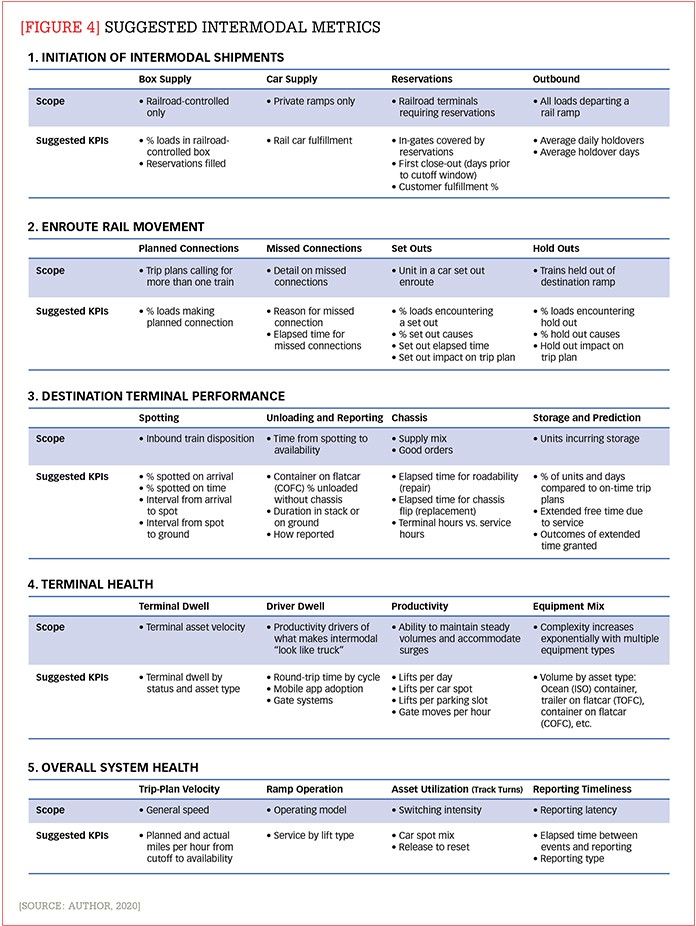
[Figure 4] Suggested intermodal metrics
Enlarge this image
1. INITIATION OF INTERMODAL SHIPMENTS
Without the right conditions in place, intermodal shipments will be destined to fail even before their movement commences. The following metrics will measure the existence of some necessary prerequisites for an intermodal move:
- Box supply: First, of course, shippers need a trailer or container to load. In some cases, private equipment is provided by the customer, while in others, the railroad provides it. How many loads are moving in railroad-supplied boxes, and how are the railroads doing in filling the requests for those boxes?
- Car supply: In some cases, such as on-dock loading by ocean carriers, private facilities have boxes to move but require a supply of rail cars to load for railroad movement. How well are railroads fulfilling that demand?
- Reservations: Some railroads have implemented reservation systems to help them manage volumes. For those that have done so, do reservations apply to all shipments, or to just a subset? During what time windows are reservations allowed to be entered, changed, and/or deleted? How far in advance is the reservation window “closed” due to allocation fulfillment? Most importantly, at what rate are reservations accepted? The burden is not entirely with the railroads. Customer fulfillment of requested reservations should also be measured.
- Outbound move: Once the load is accepted in the gate3 (with or without a reservation), did it depart as planned? If not, what is the scope of these failures to load (for example, percentage of units failing to load and average duration of holdovers).
There are some issues that need to considered. Different shippers may have different contractual commitments, so measuring the impact of the metrics introduced here without commercial context may prove problematic. There is also the challenge of how to count “multiple declinations”; for example, if a shipper has one shipment that is rejected on five consecutive days, does that count as one failure or five?
Finally, there is the issue of whether a railroad has the ability to track this information within its terminal operating system (TOS). Although such capabilities have been available for 20+ years, some railroads have been laggards in their TOS development.4 In those cases, I suggest that railroads reply “unable to answer.” I believe that the desire to avoid having to publicly say “we don’t know” would provide an incentive to remedy those information shortcomings.
2. ENROUTE RAIL MOVEMENT
Once an intermodal shipment has successfully departed from the point of origin, the next potential sources of failure arise while it is moving to its planned destination. These metrics will identify the root causes of failures that occur during this movement:
- Planned connections: What percentage of trip plans call for movement on more than one train, and what percentage of loads successfully make those transfers in time?
- Missed connections: There is a plethora of reasons why shipments fail to make connecting trains—the outbound train may depart prior to the inbound train’s arrival, train size may be exceeded, or bad weather may mandate train-length reduction, to name just a few examples. Those failures should be categorized and their impact quantified.
- Set outs: Many shippers cite the uncertainty associated with rail cars’ mechanical failure as a major obstacle to intermodal use. A truck breakdown can be remedied in hours; a similar problem with a rail car can cause a week’s delay. Metrics should track the cause, frequency (percentage of loads that encounter this problem), and duration of these set outs (that is, cars left at designated points for repair) as well as their impact on the trip plan.
- Hold outs: Rail transit is not complete until the train is moved into place at the destination ramp for unloading. While the plan may be to “spot” the train (place it at the proper location for loading or unloading) at the ramp upon arrival, that does not occur if the terminal is experiencing congestion or other operational trauma. Metrics should track the causes and frequency of these hold outs (trains waiting to access the destination ramp) as well as their impact on the trip plan.
The issues associated with these proposed metrics are similar to those discussed under “Initiation of Intermodal Shipments.” Some railroads may lack the information technology (IT) capability to measure these events, while some still do not even record them. “Unable to answer” would be the appropriate response.
3. DESTINATION TERMINAL PERFORMANCE
While all aspects of intermodal transit are important—and require measurement—the destination terminal performance has an enormous impact on the customer’s assessment of intermodal reliability. As the closest point to delivery, it has the least amount of time available for remedial action. (Think back to the air travel example, where a plane landed on time, but passengers sat on board for three hours before they could deplane.) Thus, the following metrics are particularly important to customers:
- Spotting: This metric would measure whether inbound trains are spotted according to plan—and if not, why not.5 Measuring the intervals from arrival to spot and from spot to grounding would provide enhanced transparency. This metric would also highlight the impact of running trains that are longer than what a terminal can accommodate.
- Unloading: While an intermodal trailer is self-sufficient for unloading (because it has built-in tires), a container is not truly unloaded until it has been placed on a chassis. Accordingly, if the load is a container on flatcar, then we need to understand how quickly the container is unloaded to a chassis. However, recent events have caused extended unloading delays due to congested parking and lack of chassis. Further, if the container is stacked on the ground, rather than left on a car, that time interval needs to be measured too.
- Reporting:The reporting of unloading is a service-demarcation point because it triggers notification for the drayage driver to pick up the unit. Unfortunately, there is no standard for when and how to report this event. Best practice is for the lift operator to report the individual unit’s unloading in real time; however, this is not standard procedure. The purpose of this metric is to identify how extensively best practices are applied.
- Chassis: An intermodal unit is not available for pickup until the unit is unloaded and put on a chassis. However, the mere unloading of a container onto a chassis is only the first step. If the chassis is in a condition where it cannot safely travel on public roads, then intervention is required before delivery can commence. Either the chassis must be repaired (to achieve “roadability”) or replaced (“flipped”). As part of understanding the causes of delays, we need a metric that distinguishes between repair and flip delays that are caused by queueing for a service and delays that are caused because the service is not offered. For example, some terminals are open 24/7, but only offer roadability and flips for a limited period.
- Storage: Once the consignee has been notified that an inbound unit is available, a free-time period (a specified period allowed the consignee to pick up the unit) commences, followed by storage (a charge against shipments held at the terminal beyond the allowed free time). If a unit has been delayed, storage may be inevitable because it may take many days to reschedule the delivery. What percentage of units incur storage, and what is the correlation to trip-plan compliance? Some railroads may occasionally grant extended free time. How often does that occur, and how much time is granted?
- Prediction: It’s often (correctly) said that “forewarned is forearmed.” Advance notification of service delays allows for the mitigation of adverse impacts from those delays. How proactive is the railroad in advising the customer of trip-plan changes? What percentage of units are so notified? How many times is a unit updated, and what is the magnitude of the change (whether advising earlier or later grounding/availability)? Finally, what is the time interval between the final update and the actual event?
Again, some railroads will lack the IT capability to measure these statistics. However, I suspect that some may simply not want to advise the results. Rather than eliminating a metric that is not supported unanimously, I would suggest railroads be allowed to reply, “unwilling to answer,” and then respond to the marketplace’s reaction.
4. TERMINAL HEALTH
Some current STB metrics assess the general state of the system by looking at the operating performance, or “health,” of specific, major carload yards, because a misfunctioning network node can quickly poison the entire network. We need to do the same for major intermodal terminals.
These metrics are not associated with specific components of an intermodal trip; rather, they look at how a specific terminal node is performing across all units entering, departing, and residing in it. Just as an airline passenger may switch routes to avoid bad weather or a poorly performing airport, intermodal shippers frequently have the opportunity to route around afflicted terminals. These terminal health metrics would provide the transparency necessary to assist this decision making:
- Terminal transit: How quickly are different types of assets moving through the facility? Note that inbound and outbound moves can be load, empty, bare chassis, or “bob-tail” (tractor-only with no trailer or chassis attached).
- Driver dwell: This should track driver turn time in and out of the facility. Railroads start the clock on cycle times when the driver passes through the gate; however, this ignores the amount of time the driver may have spent queuing outside the gate, which the driver, not the railroad, would have to measure.
- Mobile app adoption: Railroads have developed mobile apps and automated portals to expedite gate queues. Data generated by these technologies would enable quantification of performance by terminal location and gate move.
- Productivity: These metrics would track several key productivity indicators, such as gate moves per hour and lifts per day, among others. Because terminal congestion frequently results when productivity declines, these metrics could provide advance warning of potential productivity issues.
- Equipment mix: Different equipment types require different railcars and chassis. Because all these different “flavors” increase complexity exponentially, a condition that frequently is a harbinger of operational disruption, statistics on equipment mix could indicate a potential for slowdowns.
- Capacity reductions: To improve operations, railroads may impose temporary capacity reductions. Through theses actions, which are often referred to as “allocations,” railroads reduce the number of units they are willing to accept.6 The duration and impact of those allocations should be quantified.
Once again, railroads’ inability or reluctance to report will be the primary roadblock to providing this data. There may also be some valid reluctance to publish numbers that are perceived as unfavorable but are a realistic reflection of customer mix at a particular location.
5. OVERALL SYSTEM HEALTH
Just as we would measure the health of specific terminal operations based on changes in shipment and equipment fluidity and velocity, we need to look at overall system health by applying similar benchmarks to an individual railroad’s intermodal network. Current STB carload metrics include several metrics of this type, so the following would simply expand the concept to intermodal:
- Trip-plan velocity:What are the planned and actual trip-plan miles per hour? Trucks can travel 500 to 750 miles per 24 hours. What does intermodal offer, and what does it deliver? This will allow a clearer comparison of intermodal service to truck.
- Ramp operations: Recently the industry has seen significant disparities in intermodal terminal performance that appear to correlate with a facility’s operating model. However, there is no publicly available data that could be used to evaluate whether some terminal operating models are still valid. It would therefore be useful to correlate ramp service levels with the operating model. Questions to be asked include: Is the operation insourced or outsourced? What type of lift does the ramp perform; for example, does it deploy wide-span cranes or not?
- Asset utilization:As previously noted, terminal congestion ensues when productivity drops. How efficient are terminals in utilizing their two scarcest “hard” assets: parking and car-loading tracks? High turnover in both areas usually indicates both intensive planning and excellent execution.7
- Reporting timeliness:An intermodal terminal is a complex organism with many moving parts. To manage it effectively, all stakeholders must know where equipment and operating assets are in real time. How timely is the terminal’s reporting of a unit’s change in status? This is critical, because a load may be left behind if it is not reported as having arrived until after the train has left, or a delivery appointment can be missed if a unit was not reported as available for pickup until hours after it became available. Reporting timeliness has also historically been used as a proxy for IT capability and efficiency.
Once again, railroads’ potential reluctance to provide information that may not paint a positive picture could constrain the adoption of these proposed metrics. An additional complicating factor is that some railroads handle ramp operations themselves, while others outsource to third parties, making it more difficult to collect the necessary data.
As suggested by the potential issues associated with each of the five proposed metrics areas, there are two especially significant factors that could make railroads hesitant to adopt these measurements. First, rather than admit that they are “unable to answer”—or perhaps “unwilling to answer”—some railroads may maintain that this information is “too complex” to capture. That is just not the case with today’s technology.8 And second, there will always be reluctance to “look under the rocks”—an exercise that may reveal and require acknowledgement of weakness. However, railroads should recognize that this would also be an opportunity to highlight their successes and positive achievements.
Performance, range are both essential
For their full benefits to be achieved, metrics must reflect both performances and the range of results. Shippers need to know more than just whether specific levels were achieved. They also need to know “how wide the fairway is.” Are outliers clustered close to the target, or are calamitous outcomes frequent?
Railroads frequently report on a single threshold outcome (for example, 90% arrive within six hours of schedule). But this can paint an incomplete picture. How disparate is the remaining 10%? Is it spread over the next few hours—or the next three days? A more statistically robust basis, showing mean and quartile breakdown, is recommended to complement threshold analysis, as shown in Figure 5.
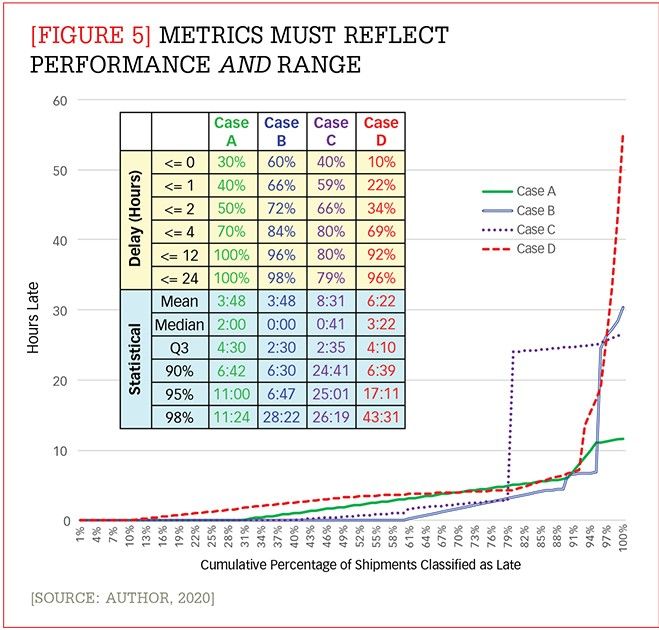
[Figure 5] Metrics must reflect performance and range
Enlarge this image
Current STB metrics are available for download and analysis. However, they are time series of single, absolute key performance indicators. Today, the analytical standard is to have data available for “slicing and dicing” along multidimensional data sources. This means that, instead of reporting a single average, data should be deliverable as a matrix of performance and range for a specified time period.
This is no longer a technical issue because large datasets are routinely provided by the public sector. Yes, the envisioned scope of data proposed in this article may be exponentially larger than what is currently captured, but why shouldn’t it be? The proposed metrics include numerous range and performance criteria, which are critical if shippers are to make accurate, optimal decisions about how—and indeed, whether—they use intermodal. The proposed scope is not even complete; there are other metrics not mentioned here (for example, day of the week) that should be critical criteria as well.
Why go to so much trouble?
When the STB’s metrics were first developed, they were intended mostly for shippers’ use. Today, it appears to me that the financial community and industry analysts are the primary consumers of that data. Indeed, although the current STB metrics are almost insignificant, there are many analysts who dutifully report on them. (In my opinion, this is something like haruspicy: ancient soothsayers who foretold the future utilizing animal entrails.)
Intermodal is not just a mode of transportation. It is important to our society for providing supply chain capacity, reducing congestion and vehicle emissions, and increasing infrastructure efficiency. Despite these and other positive aspects, for years many shippers have been reluctant to use intermodal based on anecdotes (some of them apocryphal) about past poor service.
The right metrics could change all that. What we need now are data that will be meaningful and useful to those who use intermodal services: real data to quantify intermodal’s successes and identify opportunities for improvement. With accurate information, facts will replace apocryphal anecdotes, the financial community will encourage necessary investments, and public metrics will motivate railroads to “up their game”—all leading to improvements that will drive increased usage of and greater success for intermodal.
Notes:
1. With the passage of the Interstate Commerce Act of 1887, the railroad industry became the first industry subject to federal regulation by a regulatory body. The Act was later amended to regulate other modes of transportation and commerce.
2. Train speed is also highly correlated to “mix,” since expedited, standard, and international trains run at different speeds. A change in mix—and thus, average train speed—does not necessarily translate to service issues.
3. Many intermodal shipments have two outbound initiations, with different railroads connected with a “cross-town” move.
4. In almost all cases, this has been the result of a misguided insistence on developing software internally rather than purchasing “best-of-breed” off-the-shelf solutions.
5. In certain circumstances hold outs may still result in plan compliance.
6. Allocations are a relatively new tool, as they are customized to specific customers and traffic. The formerly used approach was to issue an embargo, which was a complete cessation of traffic acceptance. The STB and Congress have never considered the distinction.
7. While parking turnover is common, less attention has traditionally been paid to car spots. When track turns are other than “load-load” (unloading followed immediately by reloading), there is increased demand for switching, which, in turn, consumes scarce operating time and reduces effective capacity. Both increase the likelihood of unfavorable operating outcomes. For example, “release-to-reset,” the period during which one set of cars on a ramp track is being replaced with a completely new set, quantifies latent terminal capacity that is readily available. The longer the time interval, the longer capacity sits idle.
8. Railroad CEOs are often unaware of how far behind the curve their company is when it comes to intermodal IT. One CEO classified his intermodal IT system as “world class”—even though it had no data elements for tracking chassis, while another bragged about adopting new capabilities that his competitors had introduced 25 years earlier.


