


Sustainability is becoming an increasingly important concern for companies across the globe, particularly in terms of their supply chain operations. It is woven into company value statements and marketed as part of their value proposition.
One excellent framework for thinking about sustainability is the concept of the triple bottom line (TBL), which was developed by the management consultant John Elkington in 1994. The TBL theory says that to be sustainable, a company needs to focus on three key areas: economic, social, and environmental. (See Figure 1.) Complying with these three sustainability pillars can produce many benefits for companies such as enhancing the brand’s image, providing a competitive advantage, and leading to efficient and effective performance. All of these benefits can, in turn, increase the company’s profits and reduce cost.
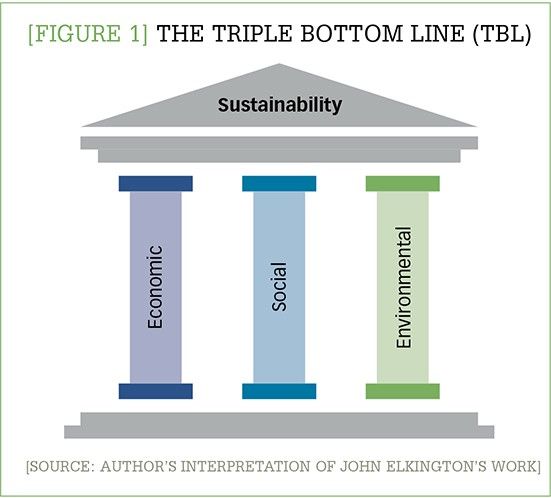
[Figure 1] The Triple Bottom Line (TBL)
Enlarge this image
However, companies often fail to take into account all aspects of sustainability when they launch a new product or service. This seemed to be particularly the case at the beginning of the coronavirus pandemic. Instead, most companies think predominantly about how to make a profit and reduce costs. While paying attention to economic sustainability is important, companies also need to give adequate attention to the remaining two sustainability pillars: the environmental and social factors. For example, some companies clearly target using the cheapest resources and labor to create their products in order to maximize their profit and do not consider the social and environmental impacts of that decision.
To make sure that they are truly pursuing a sustainability strategy and living up to the commitments made in their value statements, companies need to effectively measure their sustainability compliance and track their performance. The Sustainability Compliance Matrix Assessment (SCMA) proposed in this article can serve as such a tool. This simple framework provides a rough guideline for assessing a product or service’s impact on the three factors of the Triple Bottom Line. The intent was to create a tool that could be easily understood by the majority of people and not be overly technical in nature.
SCMA explained
The Sustainability Compliance Matrix Assessment consists of two parts: descriptive and analytical.
1. The descriptive part allows organizations to identify and examine the impact of the product or service on each pillar of the triple bottom line.
2. The analytical part uses a systematic approach to calculate the sustainability compliance for the product or service.
To calculate the sustainability compliance, the company must first determine, in a general way, how much of a negative impact the product or service will have on each of the three TBL factors. For example, will the proposed product have a minor, medium, or major impact on the environment? The impact level should be assessed based on international health, safety, and environmental regulations; best practices; and/or expert judgment.
Once an impact level is assessed for the factor, the company can then determine a rough compliance magnitude score for each factor. The top part of the table in Figure 2 shows the compliance magnitude ranges for each associated impact level. For example, if the company believes that a new product will have a severe impact on the environment, it will receive a very low compliance magnitude for the environmental part (between 0 and 40). A bigger impact will lead to a lower score. Additionally, the company can use the impact level to assign a color or zone to provide a quick indication for sustainability tracking dashboards. (For example, the new product with the low environmental compliance magnitude score will be in the red zone for the environmental factor.)
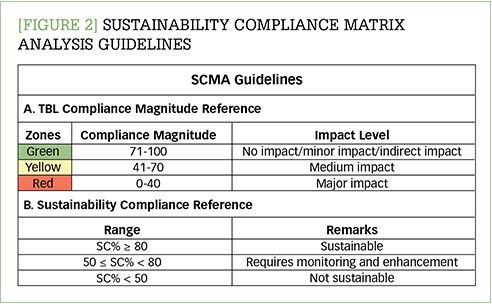
[Figure 2] Sustainability compliance matrix analysis guidelines
Enlarge this image
Having determined the compliance magnitude for each of the TBL factors, the company can then calculate the product or service’s overall sustainability compliance using the mathematical equation shown in Figure 3. The equation gives different weights for the three factors: 40% for economic, 30% for social, and 30% for environmental. We assigned a higher weight to the economic factor because it is the first thing that entrepreneurs and investors will look at before pursuing any business. It is the factor that will determine whether it is worthwhile to proceed with this idea or not.
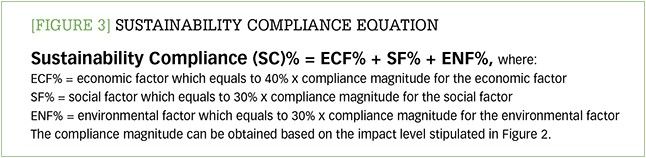
[Figure 3] Sustainability compliance equation
Enlarge this image
The bottom half of the table in Figure 2 shows the ranges for the overall sustainability compliance matrix. The sustainability compliance score gives the company an idea of what it needs to do to improve. For instance, a sustainability compliance percentage (SC%) score of 80% and above is a good indication that the product or service is in compliance with the sustainability pillars. If the SC% is between 50% and 80%, then the organization needs to monitor the situation and develop a plan for improving the product’s sustainability. If the SC% is less than 50%, this is an indication that the product or service is not meeting sustainability criteria and a serious re-evaluation of the business model needs to take place.
A company can perform a SCMA regularly to track the performance of a product or service in terms of sustainability and the TBL. For example, the sustainability compliance percentage could be updated monthly or quarterly. In addition, the company could set a target to enhance the product or service’s sustainability compliance. For example, “For product X, we need to enhance the sustainability compliance by 10% in the next quarter.”
Real-life examples
Let us now use some real-life examples of products that rose in popularity during the pandemic period to demonstrate how SCMA could be applied.
Video-conferencing applications. Video-conferencing and communication applications have been used for a long time. However, many companies and applications, such as Zoom and Microsoft Teams, rose in prominence during the COVID-19 pandemic.
Descriptive part:
•Economic: These companies make their profit mainly from monthly subscription services. One big drawback, however, is there are many competitors in the market.
•Social: These new tech companies have a positive social impact by creating jobs for many people. Also, the systems that they sell help promote a good quality of life by allowing people to meet remotely.
•Environmental: As we are talking about telecommunications and software, there is not a physical product. As a result, there is no impact on the environment.
Analytical part:
The profit outlook for a newly introduced video conferencing application or company is in the mid-range, as it is based on monthly subscriptions and has to contend with so many competitors. To reflect that reality, we set the compliance magnitude for the economic factor at 66. When you multiply that by the 40% weight, you get the economic factor percentage of 26.4%.
We set the compliance magnitude for the social factor at 80 because these companies provide jobs and have no known negative social impacts. However, we did not give this product full marks of 100 because these app companies often have a limited number of employees with no clear career path. When multiplied by the weight of 30%, we get a social factor percentage of 24%.
Full marks (100) are given to the compliance magnitude for the environmental factor since the service has no known impact on the environment. When multiplied by the 30% weight, we arrive at an environmental factor percentage of 30%. Consequently, the overall sustainability compliance is 80.4% as shown in Figure 4. A score of 80.4 indicates that video-conferencing applications are compliant with sustainability pillars.
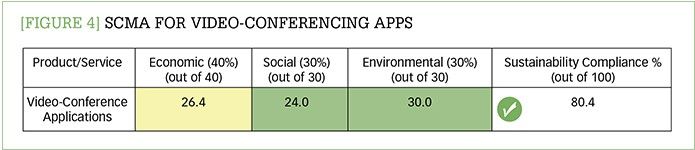
[Figure 4] SCMA for video-conferencing apps
Enlarge this image
Face masks & hand sanitizers. During 2020, there was an increase in demand for face masks and hand sanitizers as many countries tried to slow the spread of COVID-19. For a company that wants a share of the market for these products, let us apply SCMA.
Descriptive part:
•Economic: Face masks and hand sanitizer have definitely become a profitable business during the pandemic. Many countries and businesses have imposed mask mandates, and there is greater awareness of the need to wash your hands and maintain cleanliness. Furthermore, the Delta variant has made it clear that the pandemic could continue for some time. Therefore, any business related to hygiene and health seems like a favorable investment opportunity if evaluated properly. However, it is also important to consider the amount of competition that a new product would face. For example, how many different masks and hand sanitizers can you find at your local pharmacy or convenience store?
•Social: The social impact of these types of products are mixed. Both products help improve the health of the community. Additionally, the demand for masks has created jobs and the low barriers to entry have allowed even small family businesses to craft and sell reusable face masks. However, there are some potential health problems related to hand sanitizers. Swallowing just a small amount of hand sanitizer can cause poisoning in small children. Also, recalls of the Durisan brand hand sanitizer by the U.S. Food and Drug Administration (FDA) in March 2021 demonstrated the risk of microbial contamination occurring in the product. When this happens, it can lead to serious infections in people who have cuts and scrapes on their hands. Moreover, the frequent use of sanitizers could lead to severe skin diseases.
•Environmental: In general, hand sanitizers don’t have a direct impact on the environment. However, the chemicals used in them are known to have a toxic and hazardous impact on environment when they are exposed to a high temperature.
Disposable face masks and filter masks, however, have a massive impact on the environment due to the amount of waste they generate. One alternative is producing reusable face masks that can be washed at home with little impact or harm to the environment.
Analytical part:
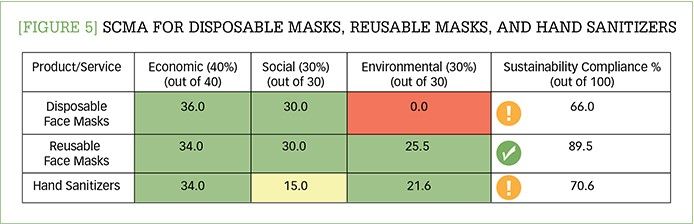
The analysis shown in Figure 5 looks at three main products: disposable masks, reusable masks, and hand sanitizers. For the disposable masks, considering the current situation that we are living under, the business is attractive financially. So, we have given this product a score of 90 for the economic factor, which puts it in the green zone. Also, because this type of product provides business opportunities even for small entrepreneurs a score of 100 is given for the social factor, also falling under the green zone. For the environmental factor, a zero score is given because disposable face masks have a massive impact on the environment. Thus, it is located in the red zone. Accordingly, the overall sustainability compliance for this product is 66%, considering the weight percentages for each category.
[Figure 5] SCMA for disposable masks, reusable masks, and hand sanitizer
Enlarge this image
Likewise, similar analysis can be performed on the other products, as shown by the sustainability compliance matrix in Figure 5. We can see that the SC% for reusable face masks is 89.5%, while for hand sanitizers it is 70.6%. From these scores, we can ascertain that reusable face masks during this time (pandemic period) are in full compliance with sustainability pillars. Meanwhile, the sustainability compliance for hand sanitizers is also acceptable but requires monitoring since there is a potential medium impact on health (social factor) as well as an indirect impact on the environment.
Disposable face masks, on the other hand, failed in the environmental factor, which consequently impacted the overall sustainability compliance score (66%). Therefore, new companies that are planning to get into this business must think very carefully about the environmental sustainability factors—not to mention, the high level of competition in the market and the variety of products available in every pharmacy or supermarket.
Plastic mats. During 2020, some companies started to advertise an unusual product: a disposable plastic mat that could be used for prayer or for a picnic. The companies claimed that these one-time-use mats minimized the possibility of COVID-19 exposure. Let us apply SCMA.
Descriptive part:
•Economic: Some companies observed that there was a need to have a one-time-use mat during the pandemic that could be utilized in mosques, gardens, and even beaches. Companies started to produce difference styles and designs to promote this product.
•Social: This product will provide some people with jobs. However, because these mats are only meant to be used during the pandemic, these jobs may not last long.
•Environmental: Since the main material used to manufacture these mats is plastic, there is a major impact on environment. Imagine how many plastic mats could be left floating around on the streets or filling up trash cans from the use of this product. According to the latest report from the General Authority of Statistics for Kingdom of Saudi Arabia in 2019, the Saudi Arabian population was 34,218,169. Now let us assume that 15% of these people used one plastic mat per day. This would leave us with around 5,132,725 plastic mats being used every day, which is equivalent to 35,929,077 mats a week and 143,716,310 mats a month. This is a scary number that would have a big impact on the ecosystem and marine life if these mats ended up in the ocean.
Analytical part:
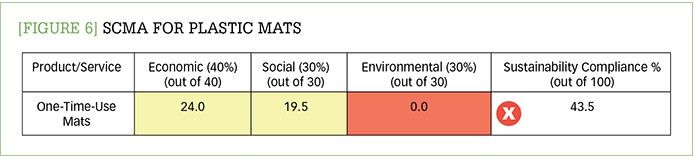
The potential waste from this product is why the environmental factor in Figure 6 is zero. Furthermore, both the economic and social factors are located within the yellow zone (medium impact). The economic factor is 24% out of 40%, as there are other alternatives to this product that are more environmentally friendly, including reusing regular fabric mats. The social factor is 19.5% out of 30%, because, while this product will provide job opportunities, it is not a sustainable product with strong projected sales growth. Therefore, the jobs are not expected to last after the pandemic.
[Figure 6] SCMA for plastic mats
Enlarge this image
Therefore, the overall sustainability compliance result is 43.5%, which should send a clear message that this product is not worthy of investment from a sustainability standpoint. From this example, we can see that even if the idea or the product is innovative and new, it should be evaluated thoroughly, considering all the sustainability pillars: economic, social, and environmental.
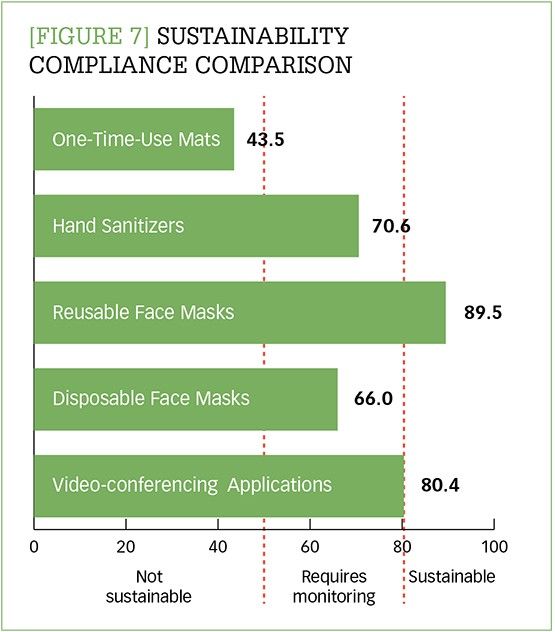
Figure 7 provides a summary of the results of applying the Sustainability Compliance Matrix Assessment to five products that rose in popularity during early days of the COVID-19 pandemic. You can see that the sustainability compliance for video-conferencing applications and reusable face masks are greater than 80% because they meet the sustainability pillars. Hand sanitizers and disposable face masks are located in the middle zone between 50% and 80%, which is an indication that there should be close monitoring and evaluation. Finally, plastic mats are classified as not sustainable products because they failed the sustainability compliance assessment (less than 50%), and accordingly the business model and marketing strategy need to be re-evaluated.
[Figure 7] Sustainability compliance comparison
Enlarge this image
Sustainability snapshot
As these examples show, the SCMA offers supply chain professionals and decision makers a new mechanism for tracking and enhancing sustainability. This simple tool can provide:
- background information about the product or service, taking into consideration the three TBL factors of economic, social, and environmental;
- an indication of the anticipated impact of the product or service on each of the sustainability pillars; and
- a visual cue for how well the product or service is meeting sustainability compliance goals.
As such, this simple tool gives decision makers a chance to review how sustainable the product or service would be prior to making a significant investment.


