Should companies continue to follow a just-in-time inventory management strategy? Or should they go back to holding safety stock just in case stockouts occur? The answer is a little bit of both.
Jonathan Byrnes (jlbyrnes@mit.edu) is a senior lecturer at the Massachusetts Institute of Technology (MIT) and is founder and chairman of Profit Isle, a SaaS profit-analytics Enterprise Profit Management company. He coauthor of the recently published book Choose Your Customer: How to Compete Against the Digital Giants and Thrive.
John Wass is CEO of Profit Isle and former senior vice president of Staples. He is a co-author of the recently published book, Choose Your Customer: How to Compete Against the Digital Giants and Thrive.
A November Wall Street Journal headline declared, “Companies Grapple with Post-Pandemic Inventories Dilemma.” The first paragraph read, “Companies are wrestling with how big their inventories should be, since the pandemic highlighted the danger of having both too much and too little stored away.” According to the article, the most important inventory question facing managers today is whether their supply chains should be just-in-time (with low inventories) or just-in-case (with high inventories).
Two important principles will enable managers to answer this question today:
The right amount of inventory for a particular product serving a specific customer depends on the customer’s profitability and the product’s demand pattern (in other words, is demand steady or erratic); and
The right definition of excellent service is always keeping your promises to your customers, but you don’t have to (and should not) make the same promises to all customers.
In other words, the right answer to the just-in-time vs. just-in-case question is both; companies should run multiple parallel supply chains with the supply chain structure and inventory strategy tailored to the specific customer and product.
In the past, this was impossible to do because companies did not have adequate information on customer profitability and product demand patterns. Instead they had to watch broad aggregate financial metrics like revenue, gross margin, and cost. They also had to monitor aggregate supply chain metrics like the percent of complete on-time order shipments. As a result, service intervals (the time between when an order is received and when the customer receives the shipment) were typically the same for all customers. In that era, it made sense to have broad, companywide policies for inventory management, like just-in-time vs just-in-case.
But today, advance analytics and business intelligence tools, such as an enterprise profit management (EPM) system, can provide profitability metrics down to the transaction level. These systems can produce the profit and demand variance information needed to set the right inventory and service intervals for every product ordered by every customer. Because an EPM system tracks every order, managers can determine both every customer’s demand variance (order pattern) for every product they purchase and every customer’s profitability. This enables astute managers to make the right service interval promises to each customer for each product, which provides the basis for determining the right inventory levels for each customer-product set.
Managers across industries who use EPM systems typically find a characteristic customer profitability pattern:
20% of their customers typically generate about 150% of the company’s profits. These “Profit Peak” customers are their large, high-profit accounts. For these customers, the objective is to flawlessly meet their needs and find ways to create service innovations that grow these relationships.
30% percent of their customers are large, money-losing accounts that end up eroding about 50% of the profits gained from the “Profit Peak” customers. In our experience, the problem with these “Profit Drain” customers is rarely that they are being offered below-market pricing but rather that they are accruing excessively high operating costs. For example, the customer may be ordering too frequently or holding excessive safety stock. In many cases, these practices are costly for both companies but can often be easily reversed.
50% of their customers are small accounts that produce minimal profit but consume about 50% of a company’s resources. For these “Profit Desert” customers, the goal is to reduce the operating costs associated with serving them while growing the few that are development prospects.
When a company is able to identify which of the three profitability categories a customer falls into and what the demand/order pattern for the product is, it finally becomes feasible and practical to tailor its inventory strategy to the customer. The company can now individualize (and keep) its customer service promises.
Make the right promises
Figure 1 presents a matrix that shows example service intervals that a company might promise to its customers. The columns represent profit-based customer segments, while the rows represent steady- vs. variable-demand patterns.
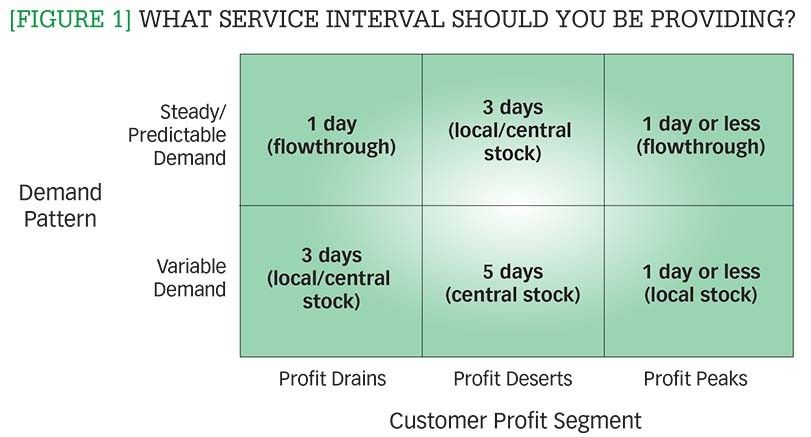
[Figure 1] What service interval should you be providing? Enlarge this image
Profit Peak customers and steady-demand products: Your Profit Peak customers provide your core profitability. Your most important supply chain task is to give each profit peak customer what it needs every time (unless supply chain disruptions make this impossible for a time). Their service interval is set at one-day (or less).
The amount of inventory needed for your profit peak customers depends on their demand variance. (Actually, it depends on the degree to which you can forecast their demand; a customer may have a lot of variance, but if you can forecast it, you can plan your inventory purchases to match the customer’s demand peaks and valleys.)
High-profit customers with steady demand products (for example, major urban hospitals buying IV solutions) only require low inventory levels. Their supply chains should be “flow-through pipelines” with minimal inventory at each point. (In other words, inventory should be replenished at a steady rate at every point in the supply chain to match the customer’s steady volume of consumption. You should only hold just enough safety stock inventory to meet emergencies.)
Profit Peak customers with variable-demand products: High-profit customers with variable-demand products (for example, major urban hospitals trying a new type of safety glasses) warrant a lot of safety stock. For these critical customers, you need to carry enough just-in-case inventory to ensure that they will almost never run out of product.
If the local distribution center (DC) runs low on one of these products, you should expedite shipments from a central facility at no cost to the customer. Their service interval is set at one day, as well.
Profit Drain customers with steady-demand products: Profit Drain customers with steady-demand products (for example, distant mid-sized hospitals purchasing IV solutions) also require only low levels of inventory. They also should have flow-through pipeline supply chains. However, their steady demand means that you will not have to carry safety stock locally. If local stock is tight, they should have lower priority than your Profit Peak customers.
Here, the service interval again should be one day, with the understanding that it will stretch to two to three days on the rare occasions that your local DC is low on stock and reserving product for your Profit Peak customers. If they insist on getting faster service in these unusual occasions, they should bear the cost of expediting the product from a central warehouse.
Profit Drain customers with variable-demand products. If a large, money-losing customer has erratic demand for a product (for example, a distantly located mid-sized hospital buying fashionable flowered gowns), it is not necessary to hold high levels of local safety stock. Instead, you should set a service interval (perhaps three days) that enables you to bring stock in from a central warehouse. The safety stock inventories of these products in the local DC should be reserved for your higher priority Profit Peak customers.
Profit Desert customers with steady-demand products: Your Profit Desert segment is comprised of numerous small customers. Typically, the top quartile of this segment (arrayed in descending order by profit) is quite profitable, the bottom quartile is quite unprofitable, and the middle quartiles produce negligible profits. Although the aggregate demand is stable, the demand for a local DC serving these customers can be very unpredictable.
The top quartile Profit Desert customers should get priority on order fulfillment over the other three quartiles. The service interval for steady-demand products (for example, consumables ordered by small machine shops) might be set at three days. In most cases, your top quartile Profit Desert customers will receive their orders in one day, but if your large Profit Peak and Profit Drain customers have a surge in demand, the three-day service interval provides ample time to bring product in from a central warehouse while still meeting your service commitments. The other three quartiles of Profit Desert customers would typically have a three-day service interval.
Profit Desert customers with variable-demand products: The service interval for variable-demand products sold to customers in the Profit Desert segment (for example, a specialized machine tool needed by a small machine shop for an occasional project) might be set at five days. This will provide ample time to bring product in from a central warehouse while giving priority on DC stock to the Profit Peak and Profit Drain customers. Because the majority of products typically have variable demand, this will greatly reduce your overall inventory costs while maintaining your high service levels. If a Profit Desert customer needs a product quickly, it should pay the cost of expediting the product from a central warehouse.
Manage your account relationships
Tailoring your service intervals to match customer profitability and demand pattern will help you keep your inventory low while keeping your service level high. If you don’t tailor your inventory strategy, you risk facing stockouts for your Profit Peak customers or carrying expensive safety stock for the Profit Drain and Profit Desert customers (which is not economically justified). The key is to be clear in advance about the “rules” of how you will serve your customers. If you always keep these promises, your service level will be 100%.
This process might raise concerns that customers will leave for other suppliers with uniformly short service intervals. However, this is often not the case. Most major customers have their own in-house inventories and are simply issuing periodic replenishment orders. Oftentimes if the service interval is a few days, the customer can adequately plan for this. The real reason why most customers want very fast deliveries is that they do not trust the supplier to meet its commitments, and the reason why most suppliers can’t meet their commitments is because they make the same short-interval commitments to every customer. If you keep your service commitments 100% of the time (and accommodate the occasional actual emergency need), your customers will be fully satisfied. If your customers do complain about your service intervals, they have the option of working with you to bring your return on serving them up to a level that warrants a shorter service interval.
Moreover, the differentiated process described above commits to one-day (or less) service intervals for all Profit Peak customers on all products and even for Profit Drain customers’ steady products. Most Profit Drain customers can tolerate a short wait for variable-demand products, especially for periodic restocking orders. Your Profit Drain and Profit Desert customers should pay compensatory prices if they want uniformly quick service and not require you to make your Profit Peak customers cross-subsidize the losses that they cause.
Manage your supply chain(s)
This process of carrying the right inventory for each customer segment is very manageable. We have described only six business segments: Profit Peak customers, Profit Drain customers, and Profit Desert customers—each with ether steady or erratic demand.
In complex companies, this matrix can be expanded to address more customer segments (for example, special development accounts) and product types (for example, mission-critical parts). However, increasing the complexity quickly makes the system much more difficult to manage and maintain.
By tailoring their inventory strategy to the customer-profit segment, managers can boost their profitability by providing the right set of incentives for each segment:
Profit Peak customers get consistently fast service, with constant priority on inventory;
Profit Drain customers get appropriate service promises, which are always kept, and they have an incentive to engage with you to bring your profitability on serving them to Profit Peak levels (giving them priority on inventory);
Profit Desert customers get appropriate service promises, which they can rely on, and they have an incentive to grow their business and profitability to Profit Peak status.
This practical process enables you to define multiple parallel supply chains, each appropriate for a distinct business segment. This is the key to setting the right inventory level for each product, aligning them with your changing business, and using your supply chain to fuel your profitable growth.
As we approach the final stretch of 2024, the rail industry is at a critical juncture, facing a convergence of long-standing challenges and emerging opportunities.
In recent years, the rail industry's story has been one of persistent headwinds: financial pressures, labor shortages, and heightened safety concerns following the East Palestine, Ohio, derailment, to name just a few. The shadows cast by these difficulties continue to loom large. These challenges, however, are symptoms of deeper, structural issues that have plagued the industry for over a decade.
Since the late 2000s, aggregate rail volumes have remained stubbornly stagnant. The initial gains from Precision Scheduled Railroading (PSR), once hailed as a revolutionary approach to operational efficiency, have largely been exhausted. The industry now grapples with this model's limitations, searching for new avenues to drive growth and profitability.
This pivotal moment demands a nuanced understanding of the sector's current state and potential trajectories.
The weight of history
In many ways, the root of today’s rail industry dilemma lies with coal. Coal was first used to generate electricity in the United States in 1882, and coal production, power plants, and railroads all grew together. In the 1970s, the development of the vast coal deposits of the Powder River Basin in Montana and Wyoming and their proximity to major rail lines fueled a massive nationwide railroad infrastructure investment cycle that lasted a decade. It was truly a bonanza.
In the early 2000s, however, advancements in hydraulic fracking and horizontal drilling led to a surge in natural gas production. As its prices fell, natural gas grew to be a titan competitor of coal for electricity generation. The impact of inexpensive and abundant natural gas has led to huge declines in coal production and coal’s share of electricity generation. According to the Energy Information Administration (EIA), coal’s share of U.S. electricity generation averaged 52% in the 1990s and fell to 16% in 2023. The natural gas share rose from 16% to 43% during that same time.
The impact on coal production, transportation, and consumption has been massive. In 2023, U.S. coal production was 577.5 million tons, representing a 51% decrease from 2008 volumes of 1.13 billion tons. During that same time, originated carloads of coal by U.S. Class I railroads peaked at 7.71 million in 2008 and plummeted to 3.43 million in 2023.
The short-term outlook is just as gloomy. According to the Association of American Railroads (AAR), coal carloads were down 17.1% from last year, the lowest January to June volume since the AAR began keeping records in 1988. Natural gas prices remain extremely low, and the cost of generating electricity from wind and solar farms has plunged. Coal’s share of U.S. electricity generation is expected to continue to decline in 2025. As a result, a significant amount of historical rail traffic will not return.
All factors considered, in the first half of 2024, U.S. railroads originated 4.17 million carloads, excluding coal and intermodal. That volume hasn’t changed much over the last 10 years, meaning that U.S. Class I’s have been unable to replace the diminished coal traffic with other carload traffic.
Filling the carload breach
Currently there are three AAR commodity segments that ship in enough volume to potentially offset the contracted coal volumes—grain, chemicals, and petroleum products. Of the three, do any provide a platform for volume growth?
Grain does offer some of the unit train economics of coal and represents about 12% of the first half of 2024 volume for U.S. railroads. However, for railroads, the grain market is divided into two very distinct sectors—domestic and international. Domestic grain demand has been relatively flat for the last 10 years, offering little opportunity for significant volume growth. The international market is quite different. While the United States is the world's largest grain exporter, volumes can swing wildly from year to year. The unpredictability of grain exports makes the entire segment risky as a growth strategy for Class I railroads.
The chemicals industry consists of thousands of producers throughout the United States, representing a material growth opportunity for Class I’s. The American Chemistry Council (ACC) reported that in 2022, 1.02 billion tons of chemicals were shipped in the United States at a cost of $79.0 billion. As a commodity segment, chemicals are the largest carload revenue source for U.S. Class I railroads. According to the ACC, rail represents 18% of total chemical tonnage while trucks led with 58%.
Like the chemicals segment, petroleum products represent a wide range of categories, including crude oil and refined products, including liquefied petroleum gases (LPGs), fuel oil, lubricating oils, aviation fuels, and other fuels. Together, they represent approximately 5% of U.S. rail-originating carload shipments.
A noteworthy structural opportunity that Class I’s can continue to nurture for growth in both the chemicals and petroleum products is south of the border. Today, Mexico’s ability to both produce and refine enough energy to meet its domestic needs is quite constrained, and that is reflected in the growth in imports from the United States. This export market represents a unique opportunity for Class I railroads.
Three things have driven this structural event. First, the Permian Basin in Texas and New Mexico creates a low-cost feedstock source for the world’s most sophisticated refining complex located in the U.S. Gulf Coast. Second, Mexico is a nearby market for both the feedstock and refining capacity. Finally, Mexico is facing a structural challenge in that its refining capacity has been operating below 50% for the last several years, and PEMEX, the Mexican state-owned petroleum company, is carrying massive debt. Railroads could serve as a vital link transporting feedstock.
The intermodal conundrum
Intermodal transport has long been considered the industry's golden ticket to growth, but in 2024, it presents a more complex picture. The segment saw a downturn in 2023, hitting its lowest volumes in three years. In June of this year, Class I railroads did report about an 8.7% volume growth in intermodal for the month over 2023. But even those numbers don't get them back to pre-pandemic levels.
However, we remain cautiously optimistic about intermodal’s long-term outlook. One way that Class I railroads could capture market share would be to target a significant volume of single-line traffic that travels between 700 and 1,500 miles and traverses only one railroad. That is a fairly sizable market for trucks right now, and if successfully converted to rail, it will add a significant amount of additional intermodal volume to the railroad’s portfolios.
To successfully compete, railroads will need to offer a compelling value proposition that can respond effectively to trucking’s current capacity surplus and low post-pandemic rates. This requires a delicate balance of pricing strategy, service reliability, and operational efficiency.
Path forward
Railroads have long faced criticism for their perceived inflexibility and reluctance to adapt to shipper needs. However, today's competitive landscape and changing customer expectations are driving rapid transformation in the industry. Class I railroads are actively working to enhance the customer experience, but they face significant challenges. To compete effectively with trucking, they must overcome deeply entrenched negative perceptions about rail shipping. This requires demonstrating unwavering commitment to their shippers and the markets they serve, as well as presenting comprehensive, forward-thinking strategies that showcase their long-term dedication to the industry.
For their part, shippers should reexamine the supply chain solutions they implemented to solve pandemic and post-pandemic challenges. They should take advantage of the current transportation market volatility to scrutinize the rates they currently pay and understand the trade-offs they can make in the marketplace to decrease overall transportation costs. Now's the time to start evaluating modal shifts. Railroads may be hungrier for traffic they didn't want to haul during the pandemic and post-pandemic years, and shippers can take advantage of a contracting truck market to inform their rail negotiations. In some cases, shippers may find that railroads have more appetite to commit to long-term contracts with fixed indices.
As we look to the future, railroads may never recover the bygone coal volumes, and their earnings profiles may be forever changed. Still, the industry's trajectory will be determined by its ability to address these interconnected challenges and opportunities brought about by the turbulence of being an integral part of the global economy. Success will require a multifaceted approach, and what worked for Class I’s in the past likely won’t help them be successful soon. All that said, it is a given that railroads will remain an integral part of North America’s industrial economy for a very long time.
Buoyed by a return to consistent decreases in fuel prices, business conditions in the trucking sector improved slightly in August but remain negative overall, according to a measure from transportation analysis group FTR.
FTR’s Trucking Conditions Index improved in August to -1.39 from the reading of -5.59 in July. The Bloomington, Indiana-based firm forecasts that its TCI readings will remain mostly negative-to-neutral through the beginning of 2025.
“Trucking is en route to more favorable conditions next year, but the road remains bumpy as both freight volume and capacity utilization are still soft, keeping rates weak. Our forecasts continue to show the truck freight market starting to favor carriers modestly before the second quarter of next year,” Avery Vise, FTR’s vice president of trucking, said in a release.
The TCI tracks the changes representing five major conditions in the U.S. truck market: freight volumes, freight rates, fleet capacity, fuel prices, and financing costs. Combined into a single index, a positive score represents good, optimistic conditions, and a negative score shows the opposite.
“ExxonMobil is uniquely placed to understand the biggest opportunities in improving energy supply chains, from more accurate sales and operations planning, increased agility in field operations, effective management of enormous transportation networks and adapting quickly to complex regulatory environments,” John Sicard, Kinaxis CEO, said in a release.
Specifically, Kinaxis and ExxonMobil said they will focus on a supply and demand planning solution for the complicated fuel commodities market which has no industry-wide standard and which relies heavily on spreadsheets and other manual methods. The solution will enable integrated refinery-to-customer planning with timely data for the most accurate supply/demand planning, balancing and signaling.
The benefits of that approach could include automated data visibility, improved inventory management and terminal replenishment, and enhanced supply scenario planning that are expected to enable arbitrage opportunities and decrease supply costs.
And in the chemicals and lubricants space, the companies are developing an advanced planning solution that provides manufacturing and logistics constraints management coupled with scenario modeling and evaluation.
“Last year, we brought together all ExxonMobil supply chain activities and expertise into one centralized organization, creating one of the largest supply chain operations in the world, and through this identified critical solution gaps to enable our businesses to capture additional value,” said Staale Gjervik, supply chain president, ExxonMobil Global Services Company. “Collaborating with Kinaxis, a leading supply chain technology provider, is instrumental in providing solutions for a large and complex business like ours.”
However, that trend is counterbalanced by economic uncertainty driven by geopolitics, which is prompting many companies to diversity their supply chains, Dun & Bradstreet said in its “Q4 2024 Global Business Optimism Insights” report, which was based on research conducted during the third quarter.
“While overall global business optimism has increased and inflation has abated, it’s important to recognize that geopolitics contribute to economic uncertainty,” Neeraj Sahai, president of Dun & Bradstreet International, said in a release. “Industry-specific regulatory risks and more stringent data requirements have emerged as the top concerns among a third of respondents. To mitigate these risks, businesses are considering diversifying their supply chains and markets to manage regulatory risk.”
According to the report, nearly four in five businesses are expressing increased optimism in domestic and export orders, capital expenditures, and financial risk due to a combination of easing financial pressures, shifts in monetary policies, robust regulatory frameworks, and higher participation in sustainability initiatives.
U.S. businesses recorded a nearly 9% rise in optimism, aided by falling inflation and expectations of further rate cuts. Similarly, business optimism in the U.K. and Spain showed notable recoveries as their respective central banks initiated monetary easing, rising by 13% and 9%, respectively. Emerging economies, such as Argentina and India, saw jumps in optimism levels due to declining inflation and increased domestic demand respectively.
"Businesses are increasingly confident as borrowing costs decline, boosting optimism for higher sales, stronger exports, and reduced financial risks," Arun Singh, Global Chief Economist at Dun & Bradstreet, said. "This confidence is driving capital investments, with easing supply chain pressures supporting growth in the year's final quarter."
The firms’ “GEP Global Supply Chain Volatility Index” tracks demand conditions, shortages, transportation costs, inventories, and backlogs based on a monthly survey of 27,000 businesses.
The rise in underutilized vendor capacity was driven by a deterioration in global demand. Factory purchasing activity was at its weakest in the year-to-date, with procurement trends in all major continents worsening in September and signaling gloomier prospects for economies heading into Q4, the report said.
According to the report, the slowing economy was seen across the major regions:
North America factory purchasing activity deteriorates more quickly in September, with demand at its weakest year-to-date, signaling a quickly slowing U.S. economy
Factory procurement activity in China fell for a third straight month, and devastation from Typhoon Yagi hit vendors feeding Southeast Asian markets like Vietnam
Europe's industrial recession deepens, leading to an even larger increase in supplier spare capacity
"September is the fourth straight month of declining demand and the third month running that the world's supply chains have spare capacity, as manufacturing becomes an increasing drag on the major economies," Jagadish Turimella, president of GEP, said in a release. "With the potential of a widening war in the Middle East impacting oil, and the possibility of more tariffs and trade barriers in the new year, manufacturers should prioritize agility and resilience in their procurement and supply chains."