


Profitability is the ultimate measure of business success for all echelons in the retail supply chain, and managing supply chain cost represents half the battle in fulfilling that mission. The other half is finding, marketing, and pricing profitable merchandise that is in demand by end users. Having better cost numbers that support decisionmaking related to merchandising and operations helps retailers and their suppliers execute both tasks.
However, many forces hinder efforts to gain control over costs. One is the rise of "virtual manufacturers" that rely on partners—often in faraway places—to produce the products they design. Another is the rise of strategies that include extended product services. A good example is distributor Arrow Electronics and its efforts to earn more from services like financing, on-site inventory management, parts tracking, and chip programming.1 Such services move beyond distributors' traditional low-margin role of matching electronic component manufacturers with industrial customers.
![[Figure 19.1] Migration to activity-based cost by product](/media-library/scq200702book-fig1.jpg?id=53612554)
![[Figure 19.2] IDEF0 node tree process definition](/media-library/scq200702book-fig2.jpg?id=53612555)
![[Figure 19.3] IDEF0 flow chart](/media-library/scq200702book-fig3.jpg?id=53612556)
![[Table 19.1] Conventional acccounting (I-A)](/media-library/scq200702book-table1.jpg?id=53612557)
![[Table 19.2] Improvement categories](/media-library/scq200702book-table2.jpg?id=53612558)
![[Table 19.3] Calculation of capital cost (II-B)](/media-library/scq200702book-table3.jpg?id=53612559)
![[Table 19.4] Vertically integrated retailer costs](/media-library/scq200702book-table4.jpg?id=53612560)
![[Table 19.5] Key ratios - vertically integrated retailer](/media-library/scq200702book-table5.jpg?id=53612561)
![[Table 19.6] Process costs](/media-library/scq200702book-table6.jpg?id=53612562)
![[Table 19.7] Gathering product line metrics](/media-library/scq200702book-table7.jpg?id=53612563)
![[Table 19.8] Calculation of cost drivers](/media-library/scq200702book-table8.jpg?id=53612564)
![[Table 19.9] Calculation of unit costs by activity](/media-library/scq200702book-table9.jpg?id=53612565)
A third force involves "make or buy" decisions. Take the example of a specialty retailer that is weighing a proposal from a logistics service provider like Argix Direct. Argix will execute four steps for specialty retailers: merchandise pickup at the source; sorting at the provider's distribution center; transport to one of 40 store-delivery terminals; and, finally, store delivery. If a company is already doing these tasks in-house, it must understand both the advantages and risks of outsourcing its work. For a smaller retailer, companies like Argix offer an existing network, automated facilities, economies of scale in transportation, and up-to-date tracking systems. Unfortunately, companies that offer such services—or those considering buying those services—may get little help from their accounting departments. Their reporting formats are designed for financial reporting rather than for managerial decision-making.
But a technique called activity-based costing (ABC) enables companies to make any number of decisions that require an understanding of supply chain costs. ABC gives companies a tool for weighing trade-offs, leading to accurate and timely supply chain decisions.
It's difficult for most companies to get a handle on their costs because they are locked into single- company accounting systems, and because they use decades-old cost-accounting methods that were designed for financial reporting rather than for cost assessment. These methods focus on precision, not on accuracy or relevance. A primary reason for this situation is that accounting practices, in the United States in particular, are required to follow what are called generally accepted accounting principles, or GAAP. GAAP is designed to capture the historical performance of the company as a whole; it seldom accurately represents the current or future financial aspect of a specific process. Guided by their chief financial officers, companies are adverse to duplication, and so they steer away from creating additional numbers beyond those that are mandatory.
A second reason for a lack of cost visibility is that the interactions between trading partners remain at arms' length. Partnerships are unnatural, particularly when it comes to discussions about money. Such discussions often assume a "zero sum" outcome, where one party's financial gain comes at the expense of the other. However, to make sizeable gains in customer service and cost effectiveness, decision-makers need to understand not only their own costs, but also the costs of their trading partners. The degree to which that happens depends on the relationship. In the best of situations, partners may provide these costs voluntarily. If, however, partners are reluctant or unwilling to share cost information, then estimates based on industry knowledge of prices along the supply chain or on supplemental research can approach reality closely enough to be sufficient for decision-making.
Implementing cost reductions or sizable gains in service levels requires cooperation among supply chain partners. The nature of the cooperation also varies from case to case. Depending on the situation, cooperation could include design changes for a product or its packaging; removal of process bottlenecks; capital investments; exchange of forecasts and sales data; modifying transportation and delivery methods; redesign of operating processes to achieve efficiencies; and other mutually advantageous measures.
But there are other potential barriers to this collaboration, beyond the possibility that partners will be unwilling or unable to work together. Once an agreement on sharing has been reached, it can be difficult to decide what information is needed and how it should be applied in making decisions. This difficulty is compounded across company boundaries because of differences in accounting systems, industry practices, language, and geographical separation.
This chapter describes a methodology for applying multicompany ABC for supply chain decision-making. The following list summarizes possible applications for shared information:
- Assessing the profitability of a product or product category.
- Adjusting the cost or retail markups* for different types of merchandise.
- Finding and prioritizing opportunities for cost reduction through process improvement.
- Comparing the profitability of private label versus major label brands.
- Comparing the cost of goods purchased offshore to that of domestic producers.
- Working with partners to assess new technologies,such as RFID.
- Negotiating prices and cost sharing.
This list should signal the reader that ABC applications are numerous, so the modest effort required to calculate activity-based costs is usually well worth the effort.
Simplified ABC
Note the use of the term "modest" in the previous section to describe the effort required to use ABC. Many organizations have pursued ABC efforts that required large investments to obtain numbers that ultimately were little used in making decisions. Today's practitioners—including Robert S. Kaplan, who introduced the concept of ABC in 1987—advise companies to adopt streamlined procedures.2
ABC proponent Douglas Hicks has long argued for what he calls the "simplified abc approach."3 This alternative approach, also called "time-based ABC," moves away from the paper-intensive time reporting required by earlier approaches. In essence, the new method creates unit times for each activity through direct measurement or other industrial engineering techniques. This facilitates measurement of capacity utilization.
For example, individuals in a work group can produce a unit of output in one hour—in other words, the unit time. Suppose the capacity of a work group is 60 units a day—representing the output of nine employees, taking downtime into consideration. If actual output is 45 units (75 percent of capacity), then there is extra capacity for growth, work additions, or staff cutbacks. This approach may call to mind older workmeasurement approaches that used stopwatches to browbeat employees into being more productive. That approach is not necessary, but knowledge of workgroup output and capacity is fundamental to managing workflow. To ensure the success of this method, it's important to seek employee participation and agreement to unit times as well as their buy-in to the process.
This simpler approach provides a "snapshot" view of costs, not a "movie." That is, cost data is assembled with a purpose—as part of an improvement project, for example. The assemblage of ABC costs becomes part of the project; it is not an ongoing, movie-like process that has to be continually maintained alongside a conventional accounting system.
The methodology described here also recommends the use of both top-down and bottom-up cost numbers. "Top down" means all costs are included and are assigned to broad company processes. "Bottom up" uses the unit-time approach to understand the cost of individual processes.
In describing ABC, it's important to clarify terminology to avoid confusion. Practitioners in strategic planning and project management use the word activity in different ways. Loosely, it can mean an operation of some kind, a process, or a set of processes. In short, activities are groups of operating processes that are the basis of a company's competitive strategy. In project management, an activity is an element of work performed during a project.
The "activity" in activity-based costing is also an operating process that can cross department and company boundaries. Activities are expressed as verb phrases, such as "put away pallet" in a warehouse or "sell merchandise" in a store. These activities produce a deliverable that defines the activity or the process driver. In the case of a process called "put away pallet," this deliverable and driver might be a pallet transfer from the loading dock to a storage space. For the "sell merchandise" activity, the driver might be dollars sold or items sold.
Other supply chain drivers include customer sales in a retail store, number of pallets handled, purchase orders, shipments, customer inquiries, and so forth. Thus, if a warehouse requires a unit time of 10 minutes per pallet to perform the put-away activity, this time can be translated into a unit cost. That cost could include labor, equipment (in the form of the forklift), and facilities (in the form of the warehouse).
Goal: Activity-based costing by product
Achieving all of the things that are possible with ABC requires development and manipulation of financial data. In Figure 19.1, the arrow illustrates the path from the current state, using conventional accounting, to the goal of activity-based cost by product. While there are other paths, the explanations in this chapter assume that a team follows the diagonal arrow shown in the figure. The vertical axis, Span of Cost Data, has four levels defining which cost data is collected. The horizontal axis has levels for organizing and presenting cost data. The improvement team, if its charter is to focus on cost reduction, might decide that III-C (multicompany process cost) would be sufficient to achieve its goals. Another team, with a charter to purge unprofitable products, would need activity-based costs by product (IV-D).
Numbers gathered in the shaded area in the lower left of the grid in Figure 19.1 are top-down costs incurred inside the organization. "Top down," mentioned earlier, means that all costs are collected, not just costs for selected processes or products targeted for improvement. These top-down costs point to opportunities for improvement, since higher-cost activities signal areas where there is improvement potential. They are also suitable for assessing product profitability at the company level or for supporting "make or buy" decisions. The unshaded area represents bottom-up costs and moves outside the company on a process-by-process basis to explore welldefined process improvement (III-C) or product profitability (IV-D) opportunities.
The lower left-hand corner (I-A) in Figure 19.1 shows the single company in a conventional approach. Its span and presentation are sufficient to produce standard financial reports. This is reflected in Table 19.1, which is a typical income-statement financial report; for illustration purposes, cost data is expressed in percentage (not absolute) terms. Confined to one company, the conventional approach reports costs by broad categories like direct labor, cost of goods sold, general and administrative, and overhead. Overhead often includes depreciation charges to cover the cost of capital employed in the business. A common approach to calculating depreciation, called straight-line depreciation, divides the initial cost of the asset by the life of the asset in years.
The income statement follows accounting principles based on industrial companies. In this model, many costs are allocated. A common example is the allocation of overhead to a direct labor base. This occurs despite the fact that direct labor in retailing, manufacturing, and other industries has been greatly reduced. Additionally, direct labor costs may not cause, or drive, the overhead costs. The failing in this method is that no costs are assigned to the activities that "consume" the resources reported. This I-A approach has a number of shortcomings with respect to supply chain management:
- It is limited to one company, and supply chain processes, by definition, cross company boundaries.
- Cost accounts are built on reporting from individual budget centers—usually the organization's functional units (e.g., purchasing, receiving, planning, store), not the processes that generate the cost (e.g., put away pallet, pick line item, or sell merchandise).
- The costs are not useful for analyzing the activities/processes that produce the cost.
- Current practices under-report capital costs associated with the activity/process by omitting the cost of capital for facilities, equipment, and working capital.
The following sections move along the path of the arrow in Figure 19.1. Each level—II-B, III-C, and IV- D—adds additional insights for decision-making.
Department costs with capital recovery (II-B)
To move from conventional accounting, the initiating company should assemble all of its own costs using the top-down approach. It should then sort them in a way that will call attention to opportunities for cost reduction. Box II-B in Figure 19.1 represents this position. This step can best be accomplished by assigning internal costs, usually in the form of budget cost centers, to improvement categories that are amenable to common cost-cutting approaches (B on the horizontal axis). This level also adds the cost of capital to fixed assets and working capital accounts (II on the vertical axis).
Table 19.2 lists cost categories that apply across the retail supply chain, regardless of echelon—retailer, distributor, original equipment manufacturer (OEM), or second-tier supplier. The recommended list includes four workforce costs; recurring costs that include the cost of capital; and three categories of purchased-item costs. For retailers, most of the purchased-item costs are for the merchandise they sell. In fact, these may dwarf the costs of internal operations. However, effectively managing internal operating processes makes the difference in customer service and profitability—particularly if one's competitors pay similar prices for the same merchandise.
Why separate costs into categories? We noted above that cost-reduction techniques for each category are different. Table 19.2 describes the environmental characteristics of each cost category. In manufacturing, for example, direct labor is often viewed as a target for cost reduction. Many manufacturers focus on this category using industrial engineering and operations research tools, even though this category may represent a small proportion of overall product cost. For manufacturers and retailers, hard-to-measure administrative and technical groups offer more potential for increased efficiency and effectiveness, but making improvements in these groups requires a wider skill set. This includes understanding not only the work content, but also the effectiveness of the function, the role of incentives, the quality of decisions, the importance of work skills, and the potential for automation.
Box II-B also upgrades capital-recovery reporting to account for the cost of money to acquire the asset. These costs fit into the Recurring Cost category in Table 19.2. Capital items include assets such as plant and equipment as well as working capital, like inventory and accounts receivable. Calculating the cost of capital utilizes a rate of interest, or discount rate. Many companies refer to this as the hurdle rate that any investment must meet in order to be approved. Companies often calculate the hurdle rate by averaging the rates of interest paid to those financing the enterprise: banks, leaseholders, shareholders, mortgage holders, franchisees, and bond investors.
Applying the discount rate, the resulting calculation is the equivalent uniform annual cost (EUAC) for the asset. This approach has variations, including EVA (Economic Value Added)4 and residual income. EUAC effectively converts the investment cost into an expense. Because the equations used for calculating EUAC are complex, practitioners use tables or calculators to determine those numbers.
Table 19.3 provides examples of EUAC calculations for different assets. Example 1 is a $1,000,000 capitalequipment item, such as a production machine or warehouse conveyor. In this example, tax accounting rules allow write-off for the equipment over 10 years. Current accounting doesn't allow the cost of capital to be added to the cost of operating equipment. But experience shows that, due to rapid obsolescence, this equipment has a likely "economic life" of only three years. Taking this and a 15 percent cost of capital into account, the EUAC approach shows an increase from $100,000 to $350,000 in the annual cost of the asset. Note that for leased equipment, the lease payments may sufficiently reflect the EUAC, as the lessor builds those costs into its lease rate.
The discount rate and asset life for dissimilar assets will vary within the same company. Example 2 in Table 19.3 shows comparable numbers for a building, which could be a store, a warehouse, corporate headquarters, or a factory. For example, a building asset may be less risky for the manufacturer or retailer since the building, but not the equipment, has a market value if the company sells the asset. For this reason, a lower cost of capital (in this case 10 percent) and a longer economic life (10 years instead of the three years in Example 1) are appropriate. Again, rent paid for a leased facility may capture these costs.
Examples 3 and 4 show working capital assets that should also be converted to expenses. Example 3 is inventory that, with conventional accounting, is only recognized on the balance sheet. As a result, some managers may consider inventory to be "free," even though the cost of carrying inventory can be huge in retail supply chains. And despite that fact, companies often do not accurately calculate the cost of inventory or assign that cost to the process steps that create it.
Sometimes supply chain negotiations between trading partners center on transferring the cost of inventory to upstream companies. Dell, in its make-toorder, direct sales model, pays its suppliers after customers pay for their orders. Dell also shares forecasts and sales data with those suppliers to help them lower their inventory. Retailer Costco follows a similar practice—like Dell, producing a negative cash-to-cash cycle. In Example 3 the company has assigned a cost of 25 percent per year to the inventory—a typical value that captures storage, financing, obsolescence, insurance, and other costs.
Example 4 in Table 19.3 stands for the asset accounts receivable. Accounts receivable is the money owed the company due to the delay between customer billing and customer payment; this is often a major item for retailers like Macy's and Target that maintain house interest-paying charge accounts. This account also should be converted to EUAC. Although it's an asset, high receivables may indicate unprofitable customers, merchandise, or lines of business. Some companies will use the cost of capital with an allowance for non-paying customers added on. In Example 4, a 20 percent cost is assigned to the accounts receivable balance.
There is considerable latitude for presenting cost information at the II-B level. Table 19.4 maps organization costs to improvement categories in a top-down example for a vertically integrated retail company. Vertically integrated, in this case, means the company has merchandising, retail, distribution, and manufacturing operations. Because of its size, it has assembled numbers for each of its principal operations (columns 2?5). The data in the columns in Table 19.4 are summarized as follows:
- Cost categories from Table 19.2 subdivided into work force costs, recurring costs, and purchased items categories.
- Costs for the merchandising department, which selects and purchases merchandise. Note that merchandising is assigned the cost of merchandise and inventories as shown in the working capital line (7). There is a division of merchandise cost into specialized and commodity material categories. The former represents fashion, or innovative, merchandise; the latter is staples, or functional, merchandise.
- Costs for internal manufacturing operation that makes an exclusive product line of merchandise, called the Widget Line.
- Costs for internal distribution centers (DCs) supplying the chain's stores.
- Costs for the company's retail stores.
Table 19.4 shows the costs that are either incurred or controlled by each of the four functions. Note that the merchandising group (column 2) is responsible for merchandise expenditures because it selects the merchandise, negotiates with suppliers, and plans replenishment. The merchandising department is also assigned the cost of inventory ($350 million), as its source selection and replenishment decisions determine the amount of inventory in the company's DCs and stores.
The captive manufacturing operation (column 3) produces the Widget Line for sale only in company stores. The costs of production are included in the merchandise costs in column 2. This in effect treats the manufacturing operation as an independent supplier. The company's DCs (column 4) are assigned only operating costs and are not charged for the merchandise that flows through the facilities. Since the DCs contract for transportation, they are responsible for these costs, shown under services on line 8. The DCs also incur a modest working capital expense for packaging and displays. The retail outlets (column 5) handle stock at their locations and sell merchandise to customers. However, the merchandising department decides what the stores will carry and generates the orders that dispatch merchandise from the DCs to those stores.
Table 19.4 also assigns drivers to the organization functions (lines 12 and 13). A driver is selected as a workload indicator because costs increase more or less directly as the driver volume increases. Precision in deciding which driver to use is secondary to finding a "mostly correct" parameter. As an example, the merchandising driver is the number of categories managed. Each additional category increases the quantity of work, inventory, replenishment activity, and merchandise cost. Dividing the total assigned cost by the volume, the number of categories managed in this case comes to 250, producing the baseline activity cost of about $4.8 million per category. Internal costs that don't include merchandise purchases (lines 9 and 10) for operating the department are just under $1.6 million per category (line 15).
Other driver candidates for the merchandise function could include number of stock-keeping units (SKUs), merchandise cost in dollars, or number of suppliers. If an analysis team were examining the workings of the merchandising department, it might use different drivers for different processes. For example, sourcing processes might use number of categories, while inventory-planning processes might use number of SKUs.
For the manufacturing operation (column 3), the driver is the number of product units manufactured annually, in this case 500,000. The activity cost per unit is $304. The DCs' cost is $250 per pallet handled, which includes both inbound and outbound pallets. Later, we will develop separate figures for inbound and outbound pallets.
The retail operations of the company employ the number of items sold as a driver. This produces a cost of $10 per transaction, regardless of the value of the transaction or the product. The sales staff is considered direct labor. Some retailers, who employ a more consultative sales model, might assign the sales staff to the technical/professional category. Later, we'll show how to treat differences in selling time for different types of product—three in this case: innovative (fashion), functional (staples), and the Widget Line.
The presentation in Table 19.4 enables quick analysis for setting baselines to measure improvement efforts or to make comparisons with other options. For example, a third-party logistics company could supplant the internal DCs, so this data would be helpful in evaluating a decision to outsource. Table 19.5 provides examples of such ratios. What emerges from the analysis is a higher-end, specialty retailer with a merchandise cost per item sold of $53 and a salesperson selling about 66 items per day.
A process flow chart is useful at the II-B level. Figures 19.2 and 19.3 provide a process view of the retailer's merchandising, distribution, and retail operations. The flow chart format is called IDEF0, a modeling language supported in business-process documentation tools. The node tree in Figure 19.2 summarizes the process. The detailed chart in Figure 19.3 shows inputs, outputs, mechanisms, and controls for each process step. The IDEF format is "top down" and is useful for drilling down into subprocesses that merit further investigation.
Multicompany process cost (III-C)
At the next level (III-C in Figure 19.1), the path moves to multicompany accounting focused on individual processes. IDEF is also useful for scoping and documenting these processes. The perspective transitions from an organization to a process view of improvement categories using the process steps in Figures 19.2 and 19.3. A method for analyzing and comparing costs includes the following steps:
- Set process boundaries.
- Prepare a process flowchart and description.
- Decide which cost categories to include.
- Assign unit costs to activity/process steps.
- Analyze the findings; prepare conclusions and recommendations.
Data from Table 19.6 illustrates how to execute these steps. This is a multicompany example, in that the case involves a cost comparison with a potential third-party logistics service provider. The logistics service provider has proposed to assume responsibility for the retailer's distribution centers. The provider claims to have better material management systems to cut inventories; economies of scale for transportation services; and automated facilities that cut labor costs. Using this case, the following sections execute the five steps listed above.
1. Set process boundaries. Any improvement project should have a meaningful, but not overreaching, scope definition. Otherwise the project team may fail. It may also "under reach," taking on a mission that is too limited when weighed against the potential for improvement. As part of its proposal, the third-party provider has estimated its costs for the process steps described in Figures 19.2 and 19.3. Because the vertically integrated retail company has not had a process view of its own costs, it must uncover how costs in departments and improvement categories are distributed to process steps (Level C on the horizontal axis of Figure 19.1). Table 19.6 shows the resulting analysis, which identifies affected processes in the merchandising and distribution departments.
2. Document process flow. Industrial engineers and other practitioners have a number of tools for representing processes. A popular option is the "swim lane," or cross-functional flowchart, where flow is charted across an organization's groups. Another is the IDEF0 format introduced above and used here to illustrate process documentation. The node tree in Figure 19.2 is "top down," meaning that each level of the various activities can be broken down into its components, depending on the needs of the project. In Figure 19.2, there is one level of decomposition of the top-level process A0 Manage Product Categories. The decomposition breaks down into five subprocesses, or activities, that show how merchandise replenishment operates.
The second IDEF0 representation is the flowchart in Figure 19.3. Each step in the process from the node tree is linked with other steps. The user-friendly documentation of process steps includes inputs, outputs, controls, and mechanisms. A team that understands how the company's processes really work can develop such a flowchart fairly quickly. This process should also evaluate which processes are effective and which are not. As the team prepares flowcharts, members should also explore why there are differences between the company's "as-is" cost and the third-party provider's proposed costs.
3. Decide which cost categories to include. This step relies on the scope of the analysis. Since the team is chartered to look at operating processes, it will decide to include the following categories:
- All of the labor categories that employ people in those processes (rows 1?4 from Table 19.4). This includes people from merchandising who order merchandise and people from the DCs who handle merchandise.
- Recurring costs that apply to the process (rows 5?7 in Table 19.4). This would include equipment and facilities employed at the warehouses as well as inventory carrying costs. In fact, the service provider is promising considerable inventory decreases, on the order of $100 million annually.
- Services related to the process, particular for transportation (row 8 in Table 19.4). The service provider expects that its existing transportation network will enjoy economies of scale.
4. Assign costs to process steps. Table 19.6 assigns internal costs to the process steps for comparison with the service provider's proposal. Using process steps creates a common ground for discussion across company boundaries. Row 1 shows process costs for the service provider of $263 million. Teams should use engineering studies, interview data, and estimates as needed, but they won't always be able to make a neat comparison with an external entity. In similar situations, however, using a standard process like this one will enable responders to document their expected costs. An improvement team can also use row 1 to enter cost estimates as if best practices were utilized.
Row 2 lists costs of the process steps from the merchandising department and the internal DCs. Beneath these totals are the components from each department (rows 3 and 4). As indicated earlier, absolute accuracy is not essential, and it probably is not even feasible. What is needed is certainty that the numbers are sufficiently accurate for decision-making for sourcing or process improvements. The cost comparison on a per-pallet basis is $657 for the third-party provider and $1,105 for the retail company, including planning, transportation, inventory carrying costs, and material handling capital and labor.
5. Analyze findings. The gap between the third-party provider's estimated costs and those of the retailer is certainly huge. Much of that gap, however, stems from working capital and facilities/equipment utilization rather than from labor costs. This prompts some questions: Do the division of responsibility or the departments' measures promote over-investment in the retail company? Are the tools for planning and forecasting doing the job that's needed? The gap between the staffing planned for activity A2 is also great: $3 million for the service provider, $10 million for the company.
The next questions these results pose for those evaluating the proposal include the following:
- Does the service provider have better processes than we do?
- Should we transfer our work to the service provider, or should we adapt the service provider's methods to our own business?
From the activity-based numbers, the answer to the first question is "most certainly." The answer to the second is more complex. If the reasons for better performance can be adapted to the organization, it makes sense to implement practices that will produce a better result. Other alternatives include reassignment of process responsibilities and adopting different measures of performance. However, if the service provider has the capacity, provides quality service, and proves willing, this function is an excellent candidate for outsourcing some or all the company's requirements.
Activity-based costs by product (IV-D)
As noted before, the requirements for cost analysis are often fulfilled at the III-C level described above. This is particularly true if process improvement is the primary goal. Note that there has been little mention of prices or profits from the sale of merchandise. Adding these factors is the mission of level IV-D in Figure 19.1. At the IV-D level, merchandise costs are captured by activity and measured against market prices to assess profitability. Without such data, the actual profitability of specific products lines is likely to be cloudy.
Such data also becomes useful in price negotiations with merchandise suppliers. The data also support efforts to rationalize the product line by purging unprofitable merchandise. Another application is price setting. As suggested at the beginning of this chapter, retailers may base their prices on across-theboard markups of their purchase costs. This method, while simple to apply, puts the retailer at risk of undercutting by competitors that have better knowledge of their costs. At best, the retailer's most profitable products will subsidize the unrecognized laggards.
Accomplishing this requires some calculations, since different processes, like those shown in Figures 19.2 and 19.3, will have different cost drivers. Also, product lines will differ in the amount of resources needed to support them. For example, selling specialized, fashion, or innovative merchandise usually requires more time than marketing functional staples does. Our retail case shows sales of three product types: specialized merchandise, commodity merchandise, and the Widget line that it manufactured itself. These form the basis of our example in the next section, which describes a method for calculating activity costs by product. This example consists of three steps.
1. Gather product line metrics. To perform this calculation, we first need data for the product lines. Table 19.7 shows an example of the data required for our three product lines: innovative, functional, and the Widget line. Lines 1 through 3 capture revenue and profitability figures. Lines 4 through 6 show the costdriver quantities for each product line. Those identified were number of categories, number of pallets handled, and number of items sold. Lines 7 through 10 show the profitability of the overall business; the ABC analysis will show the contribution of each product line, taking into account the merchandising, distribution, and selling costs for each line.
2. Adjust unit costs and volumes through engineering studies. Table 19.8 furnishes another picture of the company's cost structure. Rather than costs for organization units (Table 19.4), this presentation shows costs for process activities. Populating this table requires estimates and/or engineering studies that allocate organization unit costs to the processes. It also creates an opportunity to examine assumptions about unit volumes and the distribution of work. Table 19.8 shows two such adjustments. One is for the workload in pallets handled that are now divided between incoming and outgoing pallets. The second is for the distribution of work among store staff.
In Table 19.8, the number of outgoing pallets (process A4) is found to be three times the number of incoming pallets (process A3). The numbers (100,000 and 300,000) are on line 13. This imbalance is due to smaller loads on each outgoing pallet and the requirements for sophisticated sorting systems to assemble those loads. Also, a sales-force analysis engineering study (lines 16 through 18) in the stores shows that salespeople spend about half of their time selling innovative products. The rest of the time is about equally divided between the Widget line and functional products. The time-based cost required for each unit sold is $24, $9, and $4 respectively. These average out to $10 on a volume-weighted basis.
For process A1, which encompasses product selection and sourcing, there are two costs per unit (lines 14 and 15). The first includes the cost of the merchandise; the second excludes it, reflecting the operational cost of the process without the merchandise cost included.
3. Calculate product line profitability. The cost of the drivers can be used to calculate each product line's cost. Table 19.9 performs this task using the driver unit costs (Column 2) and the driver quantities associated with each product line from Table 19.7.
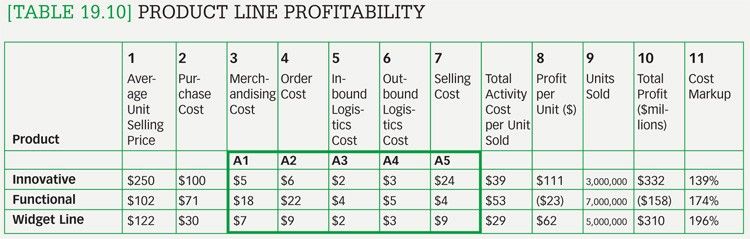
This produces the total cost of each activity by product, shown in columns 6 through 8 of Table 19.9. The cost per unit is calculated by dividing the total activity cost by the volume of product sold in each category, as shown in line 6 in Table 19.7. The results are shown in columns 9 through 11 of Table 19.9.
Table 19.10 summarizes the unit costs for each activity by product line. The box outlines these costs.
A profitability analysis by product line highlights costs and profitability. What the analysis shows is that two product lines (innovative and the Widget line) are profitable. Functional products, as a whole, are not. Options based on this analysis include the following:
- Accept that some products are unprofitable but need to be carried to fill out the product line.
- Search the functional category further and drop the lowest-profit items.
- Cut internal costs for merchandising and ordering material. These are the highest-priced activities.
- Transfer logistics for functional products to the third-party service provider, and retain control over innovative products and the Widget line.
The last option recognizes that a focused provider might best handle the high volume of these products. The company might retain responsibility for the "crown jewels," at least until the service provider has proven its effectiveness.
Understanding costs provides an advantage
Each organization will have to weigh the value of pursuing an activity-based costing effort for its own business. However, it is increasingly intractable to confine one's perspective to one's own organization. This is especially so as companies continue to outsource traditional operations. To compete in a supply chain-focused world requires a broader view of cost. Moreover, the use of across-the-board markups will inevitably overprice some and underprice other merchandise. This leaves a retailer susceptible relative to the competitor with better knowledge of costs, even if that retailer has no cost advantage. Clearly, ABC provides the tool to gain or maintain the upper hand.
* A markup is a factor added to the merchandise cost of an item to cover expenses and profit. Many retailers define markup as the percentage of the selling price consisting of margin. For example, if a retailer marked up an item that cost $2 by 50 percent, the selling price would be $4. Others might define markup as a percentage of the cost, so an item costing $2 that is selling for $4 would be marked up by 100 percent.
2 Kaplan, Robert S. and Anderson, Steven R., Timedriven activity-based costing, Harvard Business Review, November 2004, pp. 131-138.
3 Hicks, Douglas T., Activity-Based Costing: Making it Work for Small and Mid-Sized Companies, Second Edition, New York: John Wiley & Sons, Inc., 1999.
4 EVA is a trademark of Stern Stewart, a global consulting firm.


