The nation’s trucking woes are as challenging as ever. As companies work tirelessly to ship critical goods, they’re wrestling to secure capacity, control costs, and get their products to their destination on time.
Since 2017, we’ve published the quarterly U.S. Bank Freight Payment Index, which is based on data from tens of thousands of paid truck freight invoice transactions between shippers and carriers. For context, in 2021 we processed more than $37 billion in shipper and carrier payments. The Index provides a window into changes in shipping cost and volume on a quarterly basis. Importantly, we break the data down by region, as each region has unique challenges. What follows are key points from our most recent Index and other sources along with ideas for enhanced support to help navigate the industry’s ongoing volatility.
Spending growth
One trend to watch is that the Index shows continued growth in spend by shippers. Spending on truck freight in Q2 increased 3.3% from Q1 2022 and was up 19.7% year-over-year. This increase is due not only to record diesel prices but also to a movement of shipments from the spot market back to the contract market.
Most of the transaction volume that we track is from the contract market, therefore the U.S. Bank indexes are more reflective of contract freight as opposed to the more expensive spot market. Our data indicates that even though contract carriers seemed to have held their prices relatively steady, there’s increased utilization of the contract market.
In the second half of 2020 and through most of 2021, shippers relied heavily on the spot market to manage capacity challenges stemming from driver and equipment shortages. The spot market also helped address the tremendous spike in household goods spending as consumers stayed home and stocked up.
But as spending on travel and services began to increase in 2022 and the economy contracted in Q1, trucking capacity opened up and the freight market shifted back to contract carriers. The slight decrease in demand was offset, however, by the dramatic rise in fuel prices, as well as some strength in manufacturing and housing in various parts of the country. These factors helped push the spend index higher in Q2, in spite of the modest slowdown in the economy during the quarter. From a volume standpoint, the U.S. Bank National Shipments Index increased 2.3% in Q2.
Regional trends and revelations
Interestingly, changes in shipment volumes varied by region. Shipment volumes decreased for two regions—the Southeast and West—in Q2, by 4.3% and 0.7% respectively. Contrast that with the volume gains in the Northeast (7.3%) and the Midwest (6.8%). Compared to the same quarter in 2021, the Southwest recorded a 2.8% volume gain—the fifth straight quarter with a year-over-year increase. (See Figure 1.)
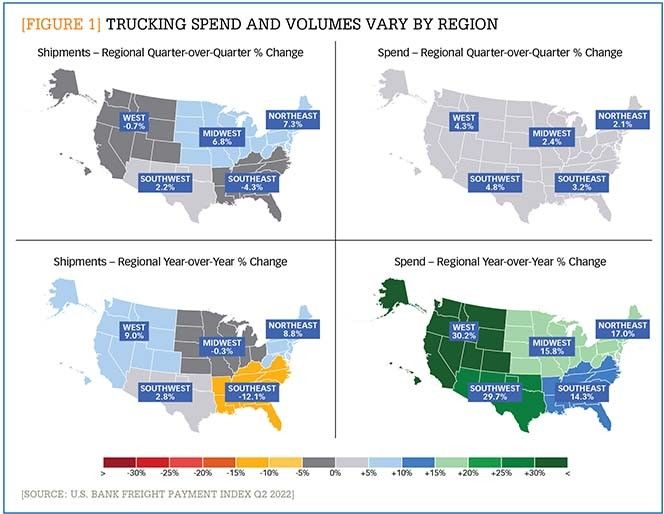
Looking more closely at the Southeast’s considerable decline, this region’s shipments index contracted a little over 12% year-over-year—far outpacing the other five. Reasons leading to this drop could include softer housing starts (a big factor for this region) and slower retail sales in the region. Although tourism-related services may be strong in the Southeast, trucking to support these services generates less volume than the transportation of goods.
Alternatively, the Midwest demonstrated the power of strong manufacturing output, which fueled higher Q2 truck freight levels in this region. Even more pronounced, the Northeast region posted its largest quarterly gain in three years. Housing starts in the region were stronger than the others, and a higher factory output helped boost freight volumes to the nation’s highest level.
Driver and equipment shortages
As noted earlier, over the past two years, the spot market surged as shippers’ contract carriers couldn’t haul the added freight during the pandemic because of capacity and driver constraints. Now, contract freight is outperforming the spot market. However, driver and equipment shortages continue to cause problems.
According to American Trucking Associations (ATA), the driver shortage is at a historic high with no end in sight.1 Over the next decade, more than one million new drivers will be needed to replace those leaving the market and enable growth, the ATA reports.
A range of incentives are being offered to recruit new drivers and retain current ones. In fact, the ATA notes that average annual earnings have increased by five times the previous standard. But some drivers are choosing to work less. Others are reluctant to make trucking their career due to lifestyle challenges—including time away from home—and other barriers to entry, such as failed drug tests, driving record infractions, and criminal histories.
Adding to the turmoil, truck parts (for new and used trucks) are in very short supply due in part to pandemic-forced factory shutdowns and other supply chain issues, such as port congestion, the Ever Given Suez Canal blockage, and weather events. To compensate, fleets are being even more vigilant about maintenance schedules, recognizing that their equipment must do more than ever before, all while maintaining excellent safety standards.
Smart support for tough times
Diesel prices, labor costs and availability, equipment costs and availability, and economic uncertainty—these are tough times for the industry. Smart use of shipping data, analytics, and industry benchmarking, however, can help companies better navigate these volatile times. Insights regarding trends affecting the entire industry—particularly spending and volume levels—can be very useful for logistics planning.
Tools such as our Freight Payment Index can help shippers analyze current freight shipping data at both national and regional levels to make informed decisions based on factors most relevant to their organization. Robust analytics can help supply chain and logistics professionals gain a further edge over their competition by providing reporting and data analysis capabilities that dive deeper into causes and effects and model options to further improve their supply chains.
Finally, benchmarking can help companies analyze utilization and spend to see where they stand compared to their peers. This analysis further enables them to gauge their performance and determine opportunities to adjust and achieve improvements.
Nationwide capacity and supply data are very dynamic. But the more an organization can anticipate issues and discuss them with its stakeholders, the more it can maintain an effective, responsive supply chain—even in the most challenging times.
Just 29% of supply chain organizations have the competitive characteristics they’ll need for future readiness, according to a Gartner survey released Tuesday. The survey focused on how organizations are preparing for future challenges and to keep their supply chains competitive.
Gartner surveyed 579 supply chain practitioners to determine the capabilities needed to manage the “future drivers of influence” on supply chains, which include artificial intelligence (AI) achievement and the ability to navigate new trade policies. According to the survey, the five competitive characteristics are: agility, resilience, regionalization, integrated ecosystems, and integrated enterprise strategy.
The survey analysis identified “leaders” among the respondents as supply chain organizations that have already developed at least three of the five competitive characteristics necessary to address the top five drivers of supply chain’s future.
Less than a third have met that threshold.
“Leaders shared a commitment to preparation through long-term, deliberate strategies, while non-leaders were more often focused on short-term priorities,” Pierfrancesco Manenti, vice president analyst in Gartner’s Supply Chain practice, said in a statement announcing the survey results.
“Most leaders have yet to invest in the most advanced technologies (e.g. real-time visibility, digital supply chain twin), but plan to do so in the next three-to-five years,” Manenti also said in the statement. “Leaders see technology as an enabler to their overall business strategies, while non-leaders more often invest in technology first, without having fully established their foundational capabilities.”
As part of the survey, respondents were asked to identify the future drivers of influence on supply chain performance over the next three to five years. The top five drivers are: achievement capability of AI (74%); the amount of new ESG regulations and trade policies being released (67%); geopolitical fight/transition for power (65%); control over data (62%); and talent scarcity (59%).
The analysis also identified four unique profiles of supply chain organizations, based on what their leaders deem as the most crucial capabilities for empowering their organizations over the next three to five years.
First, 54% of retailers are looking for ways to increase their financial recovery from returns. That’s because the cost to return a purchase averages 27% of the purchase price, which erases as much as 50% of the sales margin. But consumers have their own interests in mind: 76% of shoppers admit they’ve embellished or exaggerated the return reason to avoid a fee, a 39% increase from 2023 to 204.
Second, return experiences matter to consumers. A whopping 80% of shoppers stopped shopping at a retailer because of changes to the return policy—a 34% increase YoY.
Third, returns fraud and abuse is top-of-mind-for retailers, with wardrobing rising 38% in 2024. In fact, over two thirds (69%) of shoppers admit to wardrobing, which is the practice of buying an item for a specific reason or event and returning it after use. Shoppers also practice bracketing, or purchasing an item in a variety of colors or sizes and then returning all the unwanted options.
Fourth, returns come with a steep cost in terms of sustainability, with returns amounting to 8.4 billion pounds of landfill waste in 2023 alone.
“As returns have become an integral part of the shopper experience, retailers must balance meeting sky-high expectations with rising costs, environmental impact, and fraudulent behaviors,” Amena Ali, CEO of Optoro, said in the firm’s “2024 Returns Unwrapped” report. “By understanding shoppers’ behaviors and preferences around returns, retailers can create returns experiences that embrace their needs while driving deeper loyalty and protecting their bottom line.”
Facing an evolving supply chain landscape in 2025, companies are being forced to rethink their distribution strategies to cope with challenges like rising cost pressures, persistent labor shortages, and the complexities of managing SKU proliferation.
1. Optimize labor productivity and costs. Forward-thinking businesses are leveraging technology to get more done with fewer resources through approaches like slotting optimization, automation and robotics, and inventory visibility.
2. Maximize capacity with smart solutions. With e-commerce volumes rising, facilities need to handle more SKUs and orders without expanding their physical footprint. That can be achieved through high-density storage and dynamic throughput.
3. Streamline returns management. Returns are a growing challenge, thanks to the continued growth of e-commerce and the consumer practice of bracketing. Businesses can handle that with smarter reverse logistics processes like automated returns processing and reverse logistics visibility.
4. Accelerate order fulfillment with robotics. Robotic solutions are transforming the way orders are fulfilled, helping businesses meet customer expectations faster and more accurately than ever before by using autonomous mobile robots (AMRs and robotic picking.
5. Enhance end-of-line packaging. The final step in the supply chain is often the most visible to customers. So optimizing packaging processes can reduce costs, improve efficiency, and support sustainability goals through automated packaging systems and sustainability initiatives.
That clash has come as retailers have been hustling to adjust to pandemic swings like a renewed focus on e-commerce, then swiftly reimagining store experiences as foot traffic returned. But even as the dust settles from those changes, retailers are now facing renewed questions about how best to define their omnichannel strategy in a world where customers have increasing power and information.
The answer may come from a five-part strategy using integrated components to fortify omnichannel retail, EY said. The approach can unlock value and customer trust through great experiences, but only when implemented cohesively, not individually, EY warns.
The steps include:
1. Functional integration: Is your operating model and data infrastructure siloed between e-commerce and physical stores, or have you developed a cohesive unit centered around delivering seamless customer experience?
2. Customer insights: With consumer centricity at the heart of operations, are you analyzing all touch points to build a holistic view of preferences, behaviors, and buying patterns?
3. Next-generation inventory: Given the right customer insights, how are you utilizing advanced analytics to ensure inventory is optimized to meet demand precisely where and when it’s needed?
4. Distribution partnerships: Having ensured your customers find what they want where they want it, how are your distribution strategies adapting to deliver these choices to them swiftly and efficiently?
5. Real estate strategy: How is your real estate strategy interconnected with insights, inventory and distribution to enhance experience and maximize your footprint?
When approached cohesively, these efforts all build toward one overarching differentiator for retailers: a better customer experience that reaches from brand engagement and order placement through delivery and return, the EY study said. Amid continued volatility and an economy driven by complex customer demands, the retailers best set up to win are those that are striving to gain real-time visibility into stock levels, offer flexible fulfillment options and modernize merchandising through personalized and dynamic customer experiences.
Geopolitical rivalries, alliances, and aspirations are rewiring the global economy—and the imposition of new tariffs on foreign imports by the U.S. will accelerate that process, according to an analysis by Boston Consulting Group (BCG).
Without a broad increase in tariffs, world trade in goods will keep growing at an average of 2.9% annually for the next eight years, the firm forecasts in its report, “Great Powers, Geopolitics, and the Future of Trade.” But the routes goods travel will change markedly as North America reduces its dependence on China and China builds up its links with the Global South, which is cementing its power in the global trade map.
“Global trade is set to top $29 trillion by 2033, but the routes these goods will travel is changing at a remarkable pace,” Aparna Bharadwaj, managing director and partner at BCG, said in a release. “Trade lanes were already shifting from historical patterns and looming US tariffs will accelerate this. Navigating these new dynamics will be critical for any global business.”
To understand those changes, BCG modeled the direct impact of the 60/25/20 scenario (60% tariff on Chinese goods, a 25% on goods from Canada and Mexico, and a 20% on imports from all other countries). The results show that the tariffs would add $640 billion to the cost of importing goods from the top ten U.S. import nations, based on 2023 levels, unless alternative sources or suppliers are found.
In terms of product categories imported by the U.S., the greatest impact would be on imported auto parts and automotive vehicles, which would primarily affect trade with Mexico, the EU, and Japan. Consumer electronics, electrical machinery, and fashion goods would be most affected by higher tariffs on Chinese goods. Specifically, the report forecasts that a 60% tariff rate would add $61 billion to cost of importing consumer electronics products from China into the U.S.