The start-stop pattern of the last two years has led U.S. total business inventories to hit record highs in 2022—a total reversal of what we saw at this time last year.
Dr. Zac Rogers is an associate professor of supply chain management at Colorado State University's College of Business. He is a co-author of the monthly Logistics Managers’ Index.
Our annual inventory check-in shows that inventory levels and costs have been continuing their wild roller coaster ride over the past year as many supply chains seem to be in the throes of “the bullwhip effect.” The bullwhip effect occurs when variations in downstream demand lead to large overcorrections upstream due to delays in information, production, and distribution—all of which make forecasting difficult.
After having too much inventory in 2020, then not nearly enough in 2021, the pendulum has swung back towards abundance in 2022. Large retailers like Target and Walmart are marking down prices and cancelling orders, while smaller retailers are simply trying to stay afloat under the weight of too many goods. This is a far cry from this time last year, when the New York Times was writing articles titled “How the World Ran Out of Everything.” Case in point, total business inventories reached $2.38 trillion in May 2022—up 24% from the nadir in July 2021.1
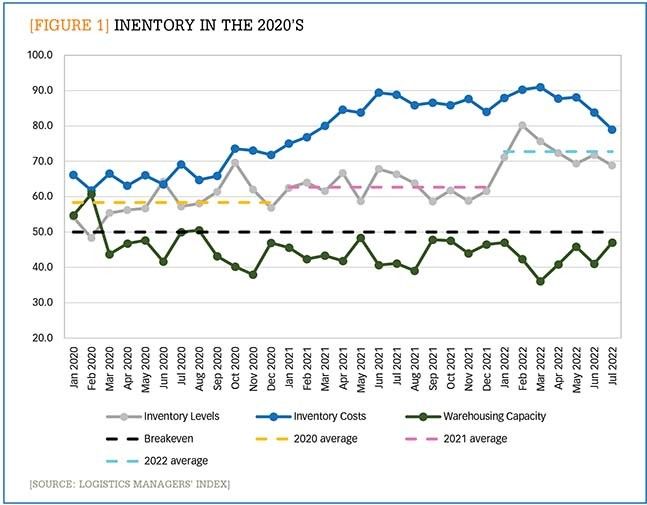
This volatility is reflected in the inventory indices that we calculate each month as part of the Logistics Managers’ Index (LMI). Figure 1 charts the inventory levels (gray line), inventory costs (blue line), and warehousing capacity (green line) metrics from the Logistics Managers’ Index (LMI) from January 2020 to July 2022. A reading above 50.0 (the black dashed line) indicates expansion, whereas anything below 50.0 indicates contraction.
Other than a slight contraction in February 2020, inventory levels have been increasing constantly over the past two and a half years. However, the rate of expansion has looked quite different year-to-year. In 2020, the average rate of expansion for inventory levels (orange dashed line) was 58.4; in 2021, the rate of expansion jumped to 62.7 (pink dashed line); and in the first seven months of 2022, it increased significantly to 72.8 (dashed teal line).
In 2020, inventory levels and inventory costs only expanded at a moderate rate, as low consumer demand led to a decline in imports and manufacturing. As lockdowns lifted in 2021, consumer demand increased. While real inventory levels rose, they struggled to keep up with this booming demand. At the same time, the increased demand combined with global supply chain congestion to drive the costs of holding and storing goods to record highs. This is reflected in the steady increase in inventory costs seen in 2021 that were incurred as firms paid dearly while competing against each other to move products towards consumers.
Through the first seven months of 2022, we have seen a statistically significant increase in inventory levels from what we saw in 2020 and 2021. This change came through a series of events. Due to shortages and congestion slowing shipments both between and within countries, firms over-ordered goods throughout much of 2021. While consumer spending was robust for much of Q4, it dropped off unexpectedly in December due in part to the Omicron surge in the Northeast. Additionally, port and inland transportation congestion meant that goods that had been due at Thanksgiving did not show up until President’s Day. Unfortunately for this late-arriving inventory, Q1 of 2022 looked much different than Q4 of 2021, as robust consumer spending was tempered by record inflation, which crippled demand for the nonessential consumer goods that many firms were suddenly flush with.
While inventory metrics fluctuated throughout the pandemic and recovery, the lack of available warehousing capacity (green line) has remained constant. LMI respondents have reported a contraction in capacity for 27 of the last 29 months. Even the approximately 738.6 million square feet of warehouse space added to the U.S. in 2020 and 2021 was not nearly enough to keep up with demand.2 This shortage of warehousing space has slowed the intake of new goods and made holding overstocked goods incredibly expensive.
Where is this headed?
Firms are attempting to deal with this high level of inventory in various ways. Some large retailers like Walmart and Costco—which reported inventory increases in the most recent quarter of 33% and 26% respectively—are discounting unsold goods to make way for the wave of imports that usually arrives during the second half of the year. Sportswear company Under Armour is pursuing another prominent strategy of cancelling orders, rescinding approximately $200 million of shipments. Meanwhile Target is employing both strategies, marking down prices and canceling orders. This aggressive approach did lead to lower inventories, but also to a 90% drop in quarterly earnings year-over-year.
Another strategy involves offloading overstocked goods into secondary inventory channels, such as off-price retailers, dollar stores, and salvage dealers. The size of these secondary markets reached a record high of over $681 billion in 2021—3% of U.S. gross domestic product (GDP).3 However, this strategy will not work for all overstocked goods. Secondary retailers operate on a high-turn strategy in which inventory moves through their systems quickly, and they are not likely to take on a high volume of off-season or soon-to-be-obsolete goods.
When asked to predict logistics activity over the next 12 months, LMI survey respondents predict that inventory levels will continue to increase, but at a significantly slowed rate of 64.8, with inventory costs growth slowing to a rate of 78.5. This slowing growth is at least partially due to the prediction that available warehousing capacity will finally begin to expand again (at a moderate rate of 51.5) over the next year.
Firms have worked diligently to burn off inventories through the first seven months of 2022, but the back-to-school and holiday seasons—and the wave of imports that come with them—will be here soon. The goal for inventory managers through the rest of 2022 will be to carefully wind down inventories, while not overcorrecting once again and ending up in another shortage situation (which is a common occurrence when the bullwhip swings back too quickly).
Threading this needle while production and delivery lead times continue to vary will make this quite the challenge. The aftermath of a global pandemic was always going to be long tailed. Hopefully, we are now closer to the end of that tail than to its beginning.
Author’s note:For more insights like those presented above, see the LMI reports posted the first Tuesday of every month at: www.the-lmi.com.
3. Z.S. Rogers, D.S. Rogers, and H. Chen, “The Importance of Secondary Markets in the Changing Retail Landscape: A Longitudinal Study in the United States and China,” Transportation Journal (2022), 61(1).
Just 29% of supply chain organizations have the competitive characteristics they’ll need for future readiness, according to a Gartner survey released Tuesday. The survey focused on how organizations are preparing for future challenges and to keep their supply chains competitive.
Gartner surveyed 579 supply chain practitioners to determine the capabilities needed to manage the “future drivers of influence” on supply chains, which include artificial intelligence (AI) achievement and the ability to navigate new trade policies. According to the survey, the five competitive characteristics are: agility, resilience, regionalization, integrated ecosystems, and integrated enterprise strategy.
The survey analysis identified “leaders” among the respondents as supply chain organizations that have already developed at least three of the five competitive characteristics necessary to address the top five drivers of supply chain’s future.
Less than a third have met that threshold.
“Leaders shared a commitment to preparation through long-term, deliberate strategies, while non-leaders were more often focused on short-term priorities,” Pierfrancesco Manenti, vice president analyst in Gartner’s Supply Chain practice, said in a statement announcing the survey results.
“Most leaders have yet to invest in the most advanced technologies (e.g. real-time visibility, digital supply chain twin), but plan to do so in the next three-to-five years,” Manenti also said in the statement. “Leaders see technology as an enabler to their overall business strategies, while non-leaders more often invest in technology first, without having fully established their foundational capabilities.”
As part of the survey, respondents were asked to identify the future drivers of influence on supply chain performance over the next three to five years. The top five drivers are: achievement capability of AI (74%); the amount of new ESG regulations and trade policies being released (67%); geopolitical fight/transition for power (65%); control over data (62%); and talent scarcity (59%).
The analysis also identified four unique profiles of supply chain organizations, based on what their leaders deem as the most crucial capabilities for empowering their organizations over the next three to five years.
First, 54% of retailers are looking for ways to increase their financial recovery from returns. That’s because the cost to return a purchase averages 27% of the purchase price, which erases as much as 50% of the sales margin. But consumers have their own interests in mind: 76% of shoppers admit they’ve embellished or exaggerated the return reason to avoid a fee, a 39% increase from 2023 to 204.
Second, return experiences matter to consumers. A whopping 80% of shoppers stopped shopping at a retailer because of changes to the return policy—a 34% increase YoY.
Third, returns fraud and abuse is top-of-mind-for retailers, with wardrobing rising 38% in 2024. In fact, over two thirds (69%) of shoppers admit to wardrobing, which is the practice of buying an item for a specific reason or event and returning it after use. Shoppers also practice bracketing, or purchasing an item in a variety of colors or sizes and then returning all the unwanted options.
Fourth, returns come with a steep cost in terms of sustainability, with returns amounting to 8.4 billion pounds of landfill waste in 2023 alone.
“As returns have become an integral part of the shopper experience, retailers must balance meeting sky-high expectations with rising costs, environmental impact, and fraudulent behaviors,” Amena Ali, CEO of Optoro, said in the firm’s “2024 Returns Unwrapped” report. “By understanding shoppers’ behaviors and preferences around returns, retailers can create returns experiences that embrace their needs while driving deeper loyalty and protecting their bottom line.”
Facing an evolving supply chain landscape in 2025, companies are being forced to rethink their distribution strategies to cope with challenges like rising cost pressures, persistent labor shortages, and the complexities of managing SKU proliferation.
1. Optimize labor productivity and costs. Forward-thinking businesses are leveraging technology to get more done with fewer resources through approaches like slotting optimization, automation and robotics, and inventory visibility.
2. Maximize capacity with smart solutions. With e-commerce volumes rising, facilities need to handle more SKUs and orders without expanding their physical footprint. That can be achieved through high-density storage and dynamic throughput.
3. Streamline returns management. Returns are a growing challenge, thanks to the continued growth of e-commerce and the consumer practice of bracketing. Businesses can handle that with smarter reverse logistics processes like automated returns processing and reverse logistics visibility.
4. Accelerate order fulfillment with robotics. Robotic solutions are transforming the way orders are fulfilled, helping businesses meet customer expectations faster and more accurately than ever before by using autonomous mobile robots (AMRs and robotic picking.
5. Enhance end-of-line packaging. The final step in the supply chain is often the most visible to customers. So optimizing packaging processes can reduce costs, improve efficiency, and support sustainability goals through automated packaging systems and sustainability initiatives.
That clash has come as retailers have been hustling to adjust to pandemic swings like a renewed focus on e-commerce, then swiftly reimagining store experiences as foot traffic returned. But even as the dust settles from those changes, retailers are now facing renewed questions about how best to define their omnichannel strategy in a world where customers have increasing power and information.
The answer may come from a five-part strategy using integrated components to fortify omnichannel retail, EY said. The approach can unlock value and customer trust through great experiences, but only when implemented cohesively, not individually, EY warns.
The steps include:
1. Functional integration: Is your operating model and data infrastructure siloed between e-commerce and physical stores, or have you developed a cohesive unit centered around delivering seamless customer experience?
2. Customer insights: With consumer centricity at the heart of operations, are you analyzing all touch points to build a holistic view of preferences, behaviors, and buying patterns?
3. Next-generation inventory: Given the right customer insights, how are you utilizing advanced analytics to ensure inventory is optimized to meet demand precisely where and when it’s needed?
4. Distribution partnerships: Having ensured your customers find what they want where they want it, how are your distribution strategies adapting to deliver these choices to them swiftly and efficiently?
5. Real estate strategy: How is your real estate strategy interconnected with insights, inventory and distribution to enhance experience and maximize your footprint?
When approached cohesively, these efforts all build toward one overarching differentiator for retailers: a better customer experience that reaches from brand engagement and order placement through delivery and return, the EY study said. Amid continued volatility and an economy driven by complex customer demands, the retailers best set up to win are those that are striving to gain real-time visibility into stock levels, offer flexible fulfillment options and modernize merchandising through personalized and dynamic customer experiences.
Geopolitical rivalries, alliances, and aspirations are rewiring the global economy—and the imposition of new tariffs on foreign imports by the U.S. will accelerate that process, according to an analysis by Boston Consulting Group (BCG).
Without a broad increase in tariffs, world trade in goods will keep growing at an average of 2.9% annually for the next eight years, the firm forecasts in its report, “Great Powers, Geopolitics, and the Future of Trade.” But the routes goods travel will change markedly as North America reduces its dependence on China and China builds up its links with the Global South, which is cementing its power in the global trade map.
“Global trade is set to top $29 trillion by 2033, but the routes these goods will travel is changing at a remarkable pace,” Aparna Bharadwaj, managing director and partner at BCG, said in a release. “Trade lanes were already shifting from historical patterns and looming US tariffs will accelerate this. Navigating these new dynamics will be critical for any global business.”
To understand those changes, BCG modeled the direct impact of the 60/25/20 scenario (60% tariff on Chinese goods, a 25% on goods from Canada and Mexico, and a 20% on imports from all other countries). The results show that the tariffs would add $640 billion to the cost of importing goods from the top ten U.S. import nations, based on 2023 levels, unless alternative sources or suppliers are found.
In terms of product categories imported by the U.S., the greatest impact would be on imported auto parts and automotive vehicles, which would primarily affect trade with Mexico, the EU, and Japan. Consumer electronics, electrical machinery, and fashion goods would be most affected by higher tariffs on Chinese goods. Specifically, the report forecasts that a 60% tariff rate would add $61 billion to cost of importing consumer electronics products from China into the U.S.