The past few years saw high demand and tight capacity, putting carriers in the proverbial driver’s seat. But as demand leveled off and inventory rose, the market has swung back in favor of shippers. After being burned by sky-high rates and some carriers failing to live up to prior agreements, many shippers are rethinking the annual bidding process and are looking at other options to lock down transportation capacity, according to the report. These include shorter deals, greater use of the spot market, and mini-bids.
“We believe that the second half of 2022, and what we are seeing in 2023 so far, has been all about getting back in sync with the fundamental change in the equation between shippers and carriers,” said report lead author Balika Sonthalia, partner at the consulting company Kearney. “And in addition to that, we are also seeing that supply chain executives are being more thoughtful and seizing the moment to address structural costs and strengthen the foundation.”
Every year, the State of Logistics Report seeks to detail all costs associated with moving freight through the U.S. supply chain. This year’s report—which was prepared by Kearney for the industry association CSCMP—studies the calendar year 2022 and the first few months of 2023. It also provides an analysis of the state of the economy and looks ahead at key logistics trends to watch. The report is sponsored by Penske Logistics.
In spite of a softening in the overall logistics and transportation market over the past year, U.S. business logistics costs continued to rise, due in a large part to the effects of inflation and a hot labor market. In 2022, U.S. business logistics costs (USBLC) reached $2.3 trillion, a 19.6% rise over 2021. As a result, logistics costs represented 9.1% of U.S. gross domestic product in 2022. (See Exhibit 1.) Sonthalia, however, expects to see these numbers drop in succeeding years.
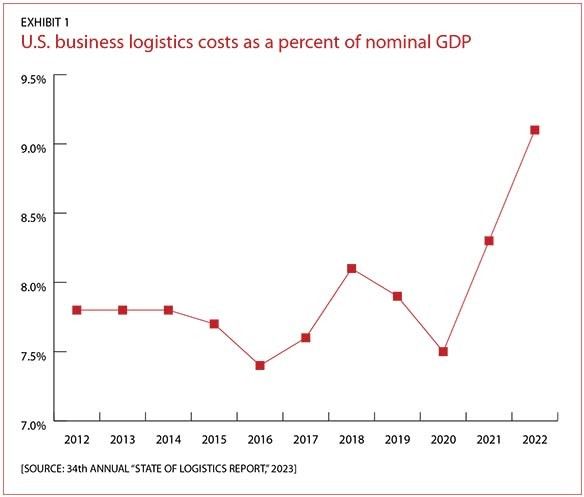
[EXHIBIT 1] U.S. business logistics costs as a percent of nominal GDP
“I believe with all the corrections that are taking place between all the transportation categories, we expect to see a significant return to the levels we are used to seeing of USBLC as a percentage of GDP,” said Sonthalia. “However, with the lingering shadow of inflation, we see prices remain elevated in certain categories and on certain routes. A lot will depend on the monetary policy, even with the [recent] pause in the interest rate hikes.”
The report stresses that to succeed going forward, shippers and carriers will need to reset their relationships to be less transactional or adversarial and more strategic and collaborative. “If the past years have taught us anything, it is that uncertainty is now a near constant in the global economy, and the smartest way to respond in good times is to gather resources for when conditions suddenly shift again,” says the report.
Logistics trends that shippers and carriers will have to work together to address include increasingly complex order fulfillment requirements due e-commerce growth, reshoring, geopolitical upheaval, and climate change, according to the report.
Analysis by mode
The report takes a close look at each of the main logistics sectors and transportation modes, including the following:
Air: Rates for air cargo dropped 33% from January to December 2022, as demand fell, customers increased their use of ocean freight, and capacity increased as passenger travel returned to pre-pandemic levels. Worldwide air cargo revenue is expected to be $150 billion for 2023, a 25% drop from 2022.
Parcel and last mile: As e-commerce growth eased, parcel volumes dropped by 2% in 2022. Revenue, however, rose as the major companies increased rates. The U.S. parcel market grew 4.7% year over year to $217 billion in 2022.
Water/ports: The major ocean freight companies saw combined operating profits of $215 billion in 2022 due to the strength of the early months of the year. But in the back half of 2022 and into 2023, demand fell, and ships and containers became more available. As a result, 2023 profits are projected to drop by 80% year over year.
Motor freight: Demand for over-the-road transportation stayed basically the same in 2022, while capacity increased. This shift has driven down rates significantly. Spot market rates for dry van, for example, fell 23% from the early months of 2022 to the early months of 2023.
Rail: Rate increases helped Class I railroads see operating income increase by 8% and total revenue by 14% from 2021 to 2022. The rail sector, however, suffered from severe service-related issues in 2022, including congestion, slow network speeds, and increased terminal dwell time.
Warehousing: In 2022, historically low warehouse vacancy rates of 2.9% pushed rents higher and encouraged robust construction of new facilities. But instead of moving into these new facilities, many companies are focusing on trimming inventory and better using existing space. As a result, pricing and availability is expected to be more favorable to shippers in 2023.
In spite of the rebalancing occurring the market, Sonthalia stressed that this phenomenon should not be interpreted as a return to normal.
“We call it the ‘great reset’ for a reason,” she said. “We did not call it ‘return to normal.’ There will not be a ‘new normal.’ The way to think about the reset is simply bringing back the balance. [In 2021] everything was imbalanced more in the favor of one player and there was another player that was losing. We saw over the course of last year and going into this year, the playing field is a bit more leveled. That is another way to think about the reset which gives everyone—shippers, carriers, alike—an opportunity to think through how to become better moving forward.”
Just 29% of supply chain organizations have the competitive characteristics they’ll need for future readiness, according to a Gartner survey released Tuesday. The survey focused on how organizations are preparing for future challenges and to keep their supply chains competitive.
Gartner surveyed 579 supply chain practitioners to determine the capabilities needed to manage the “future drivers of influence” on supply chains, which include artificial intelligence (AI) achievement and the ability to navigate new trade policies. According to the survey, the five competitive characteristics are: agility, resilience, regionalization, integrated ecosystems, and integrated enterprise strategy.
The survey analysis identified “leaders” among the respondents as supply chain organizations that have already developed at least three of the five competitive characteristics necessary to address the top five drivers of supply chain’s future.
Less than a third have met that threshold.
“Leaders shared a commitment to preparation through long-term, deliberate strategies, while non-leaders were more often focused on short-term priorities,” Pierfrancesco Manenti, vice president analyst in Gartner’s Supply Chain practice, said in a statement announcing the survey results.
“Most leaders have yet to invest in the most advanced technologies (e.g. real-time visibility, digital supply chain twin), but plan to do so in the next three-to-five years,” Manenti also said in the statement. “Leaders see technology as an enabler to their overall business strategies, while non-leaders more often invest in technology first, without having fully established their foundational capabilities.”
As part of the survey, respondents were asked to identify the future drivers of influence on supply chain performance over the next three to five years. The top five drivers are: achievement capability of AI (74%); the amount of new ESG regulations and trade policies being released (67%); geopolitical fight/transition for power (65%); control over data (62%); and talent scarcity (59%).
The analysis also identified four unique profiles of supply chain organizations, based on what their leaders deem as the most crucial capabilities for empowering their organizations over the next three to five years.
First, 54% of retailers are looking for ways to increase their financial recovery from returns. That’s because the cost to return a purchase averages 27% of the purchase price, which erases as much as 50% of the sales margin. But consumers have their own interests in mind: 76% of shoppers admit they’ve embellished or exaggerated the return reason to avoid a fee, a 39% increase from 2023 to 204.
Second, return experiences matter to consumers. A whopping 80% of shoppers stopped shopping at a retailer because of changes to the return policy—a 34% increase YoY.
Third, returns fraud and abuse is top-of-mind-for retailers, with wardrobing rising 38% in 2024. In fact, over two thirds (69%) of shoppers admit to wardrobing, which is the practice of buying an item for a specific reason or event and returning it after use. Shoppers also practice bracketing, or purchasing an item in a variety of colors or sizes and then returning all the unwanted options.
Fourth, returns come with a steep cost in terms of sustainability, with returns amounting to 8.4 billion pounds of landfill waste in 2023 alone.
“As returns have become an integral part of the shopper experience, retailers must balance meeting sky-high expectations with rising costs, environmental impact, and fraudulent behaviors,” Amena Ali, CEO of Optoro, said in the firm’s “2024 Returns Unwrapped” report. “By understanding shoppers’ behaviors and preferences around returns, retailers can create returns experiences that embrace their needs while driving deeper loyalty and protecting their bottom line.”
Facing an evolving supply chain landscape in 2025, companies are being forced to rethink their distribution strategies to cope with challenges like rising cost pressures, persistent labor shortages, and the complexities of managing SKU proliferation.
1. Optimize labor productivity and costs. Forward-thinking businesses are leveraging technology to get more done with fewer resources through approaches like slotting optimization, automation and robotics, and inventory visibility.
2. Maximize capacity with smart solutions. With e-commerce volumes rising, facilities need to handle more SKUs and orders without expanding their physical footprint. That can be achieved through high-density storage and dynamic throughput.
3. Streamline returns management. Returns are a growing challenge, thanks to the continued growth of e-commerce and the consumer practice of bracketing. Businesses can handle that with smarter reverse logistics processes like automated returns processing and reverse logistics visibility.
4. Accelerate order fulfillment with robotics. Robotic solutions are transforming the way orders are fulfilled, helping businesses meet customer expectations faster and more accurately than ever before by using autonomous mobile robots (AMRs and robotic picking.
5. Enhance end-of-line packaging. The final step in the supply chain is often the most visible to customers. So optimizing packaging processes can reduce costs, improve efficiency, and support sustainability goals through automated packaging systems and sustainability initiatives.
That clash has come as retailers have been hustling to adjust to pandemic swings like a renewed focus on e-commerce, then swiftly reimagining store experiences as foot traffic returned. But even as the dust settles from those changes, retailers are now facing renewed questions about how best to define their omnichannel strategy in a world where customers have increasing power and information.
The answer may come from a five-part strategy using integrated components to fortify omnichannel retail, EY said. The approach can unlock value and customer trust through great experiences, but only when implemented cohesively, not individually, EY warns.
The steps include:
1. Functional integration: Is your operating model and data infrastructure siloed between e-commerce and physical stores, or have you developed a cohesive unit centered around delivering seamless customer experience?
2. Customer insights: With consumer centricity at the heart of operations, are you analyzing all touch points to build a holistic view of preferences, behaviors, and buying patterns?
3. Next-generation inventory: Given the right customer insights, how are you utilizing advanced analytics to ensure inventory is optimized to meet demand precisely where and when it’s needed?
4. Distribution partnerships: Having ensured your customers find what they want where they want it, how are your distribution strategies adapting to deliver these choices to them swiftly and efficiently?
5. Real estate strategy: How is your real estate strategy interconnected with insights, inventory and distribution to enhance experience and maximize your footprint?
When approached cohesively, these efforts all build toward one overarching differentiator for retailers: a better customer experience that reaches from brand engagement and order placement through delivery and return, the EY study said. Amid continued volatility and an economy driven by complex customer demands, the retailers best set up to win are those that are striving to gain real-time visibility into stock levels, offer flexible fulfillment options and modernize merchandising through personalized and dynamic customer experiences.
Geopolitical rivalries, alliances, and aspirations are rewiring the global economy—and the imposition of new tariffs on foreign imports by the U.S. will accelerate that process, according to an analysis by Boston Consulting Group (BCG).
Without a broad increase in tariffs, world trade in goods will keep growing at an average of 2.9% annually for the next eight years, the firm forecasts in its report, “Great Powers, Geopolitics, and the Future of Trade.” But the routes goods travel will change markedly as North America reduces its dependence on China and China builds up its links with the Global South, which is cementing its power in the global trade map.
“Global trade is set to top $29 trillion by 2033, but the routes these goods will travel is changing at a remarkable pace,” Aparna Bharadwaj, managing director and partner at BCG, said in a release. “Trade lanes were already shifting from historical patterns and looming US tariffs will accelerate this. Navigating these new dynamics will be critical for any global business.”
To understand those changes, BCG modeled the direct impact of the 60/25/20 scenario (60% tariff on Chinese goods, a 25% on goods from Canada and Mexico, and a 20% on imports from all other countries). The results show that the tariffs would add $640 billion to the cost of importing goods from the top ten U.S. import nations, based on 2023 levels, unless alternative sources or suppliers are found.
In terms of product categories imported by the U.S., the greatest impact would be on imported auto parts and automotive vehicles, which would primarily affect trade with Mexico, the EU, and Japan. Consumer electronics, electrical machinery, and fashion goods would be most affected by higher tariffs on Chinese goods. Specifically, the report forecasts that a 60% tariff rate would add $61 billion to cost of importing consumer electronics products from China into the U.S.