


From 2020 to 2022, the inventory situation in the U.S. could be described as like a roller coaster. Lockdowns led to too many goods through the first half of 2020, stimulus-fueled consumer spending led to too few through 2021, and then inventories hit record highs in early 2022 as inflation went through the roof. Inventories then steadily declined through late 2022 and the first half of 2023. Inventories are now showing signs of stabilizing and it appears that the roller coaster ride is ending as we finally move back to “normal.”
The path back to normalcy has been difficult. Essentially, firms were spending unprecedented amounts of money to meet consumer demand in 2020 and 2021, and 2022 was the year the bill came due. Very few firms were shielded from this impact, as inventory reductions were the leading factor in U.S. gross domestic product (GDP) contracting in the second quarter of 2022.
The easing of the inventory burden is illustrated by the Logistics Managers’ Index (LMI). The LMI is a change index in which any value over 50.0 indicates expansion, with higher values indicating greater rates of expansion. Anything under 50.0 indicates contraction, with lower values indicating grater rates of contraction. The July 2023 Inventory Levels Index reads in at 41.9, indicating the fastest rate of decline since the index began in 2016; and when combined with the May and June 2023 readings, marking the first-ever instance of multiple consecutive months of contraction. The contraction we see this summer is a far cry from the reading of 71.8 we saw in June 2022.
Despite the all-time lows hit this summer, there is some evidence that the long and painful drop that has been going on since early 2022 is beginning to subside. Retailers like Target and Walmart are back in “good shape,” with inventories “right sized” for the near future. The Institute for Supply Management’s June survey of manufacturers reported that inventories are down and even approaching a level that some manufacturers would consider to be “too low.”1
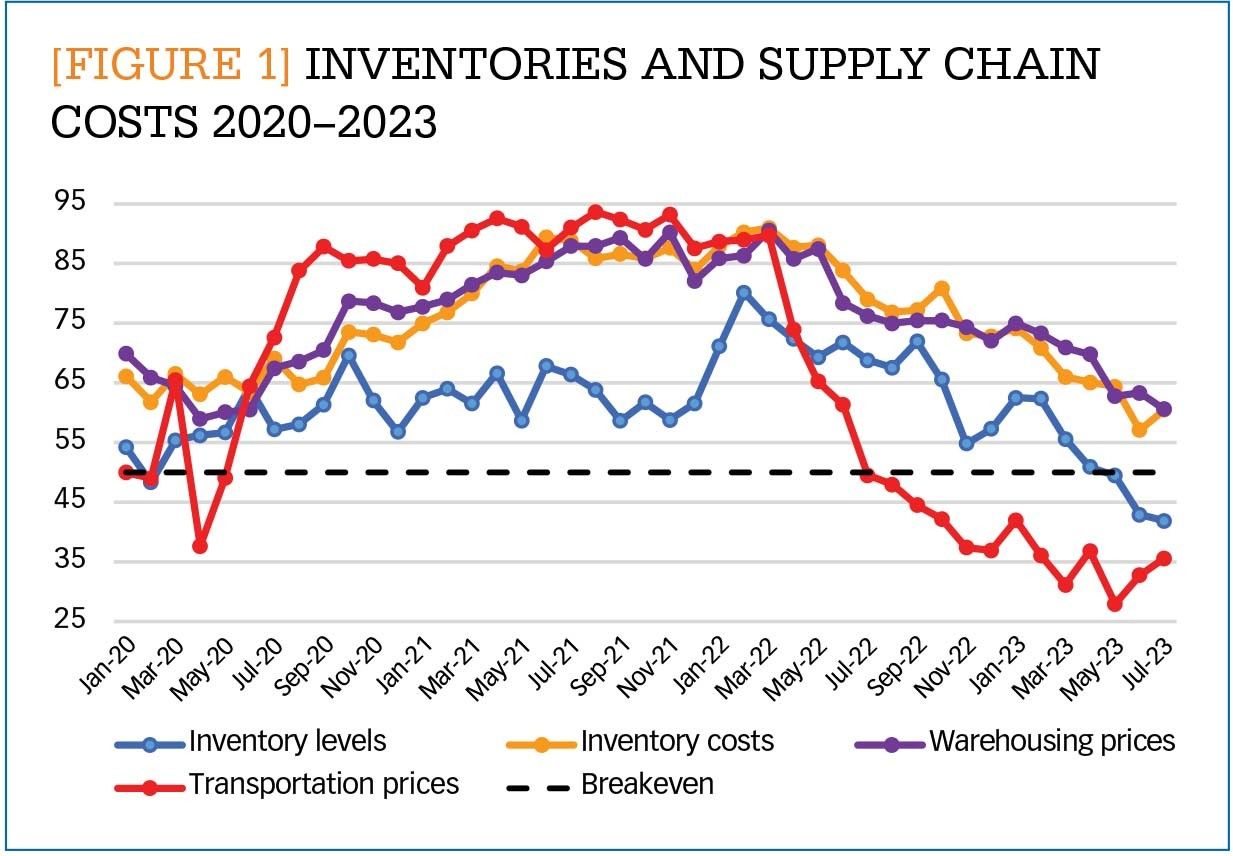
So, do these low inventory numbers portend the recession that many have been forecasting for the last year? No. In fact, in a somewhat counterintuitive fashion, low inventories may be just what the economy needs to get back on track. The reason why can be understood if we analyze Figure 1, which displays LMI data for inventory levels, inventory costs, warehousing prices, and transportation prices. Inventory levels peaked at an all-time high of 80.2 in February of 2022. This put significant stress on supply chain capacity and drove costs through the roof.
When all three of the cost metrics in Figure 1 are combined, it provides an aggregate supply chain cost ranging from 0–300 with a breakeven level of 150. Aggregate costs reached their highest ever level of 271.4 in March 2022. Interestingly, the San Francisco Federal Reserve’s estimate of inflation coming from supply issues peaked at the same time.2 The heavy inventory burden was driving the costs of supply chains up and contributing heavily to inflation. If we fast forward to July 2023, we can see that inventories are contracting, and all three of the cost metrics are down significantly from where they were a year ago.
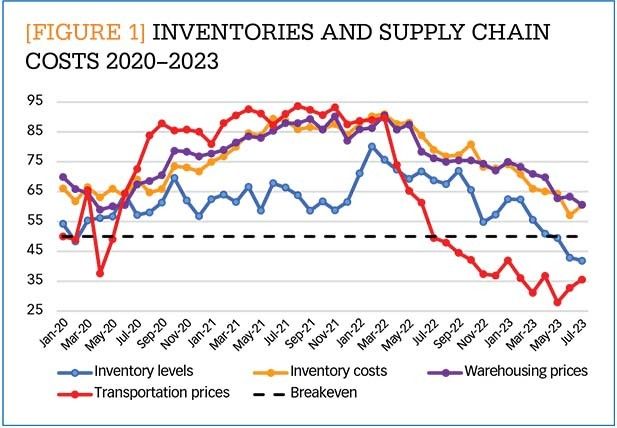
[FIGURE 1] Inventories and supply chain costs 2020-2023
Enlarge this image
Aggregate supply costs read in at an all-time low of 153.2 in June of 2023 and then at 156.7 in July, both of which are close to essentially no growth. Relatedly, the Federal Reserve estimated that supply pressures were actively lowering inflation during the spring of 2023. Evidence of this can be seen in the Consumer Price Index dipping to 3% (significantly lower than the 9.1% seen in June 2022) and more sophisticated inflation measures—such as “supercore” measures (which excludes goods with volatile prices like food, energy, used cars, and shelter) and the Harmonized Index of Consumer Prices—returning to normal levels. When taken together this suggests that high inventories strained supply chains and were a large factor behind inflation. Now that inventories have been reduced, supply pressure is contracting, and inflation is slowing. Essentially, as inventories are reaching a healthy level, the overall economy is getting healthier as well.
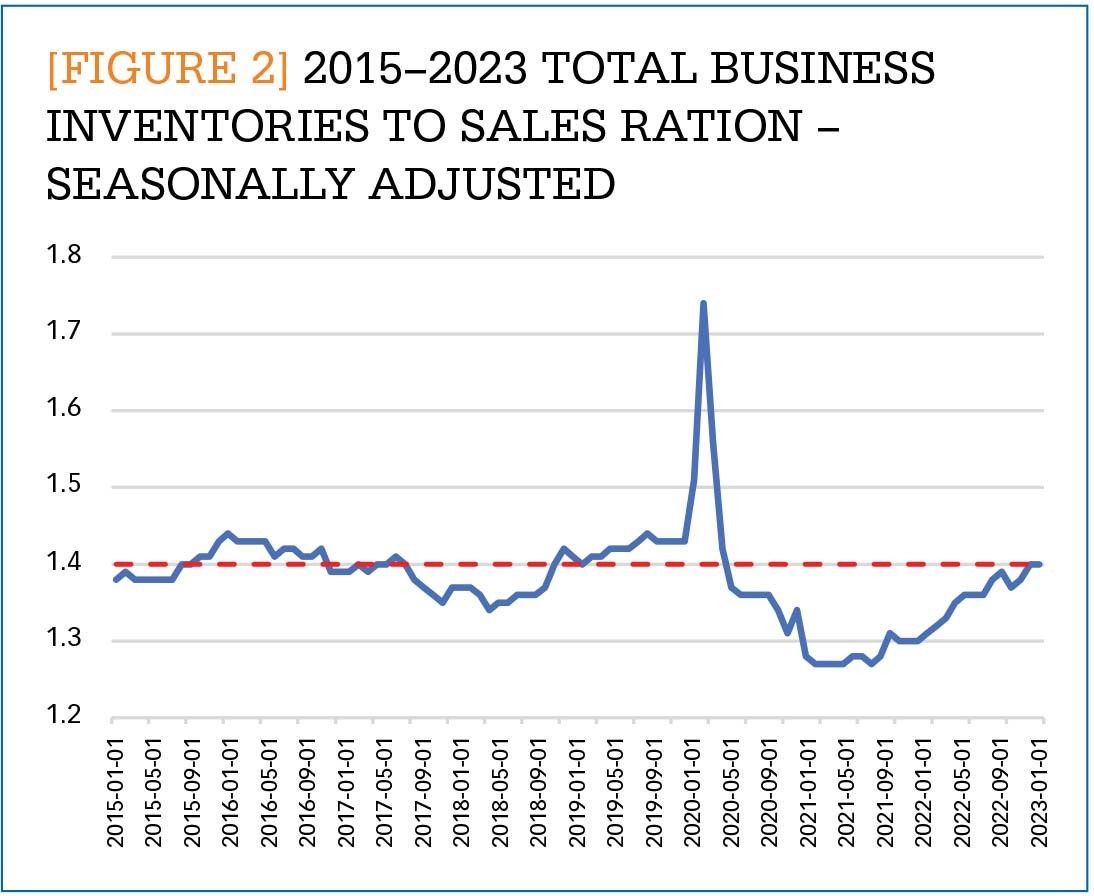
It should also be pointed out that inventories are not actually abnormally low, they are just lower than they were during the crisis and recovery of the last few years. Data from the U.S. Census Bureau tracking the seasonally adjusted inventory-to-sales ratio for total business inventories for 2015–2023 show signs of a return to normal. (See Figure 2.) Inventory-to-sales ratios are helpful in the context of 2022–2023 because inflation impacts each side of the ratio. As inventories become more expensive, sales prices increase along with them. The average inventory-to-sales ratio from 2015–2019 is represented by the dashed red line. When firms had more inventory than they could sell, as in the spring of 2020, the inventory-to-sales ratio increased. Conversely, the ratio decreased in the summer of 2021 when inventory was being sold very quickly and firms were having a difficult time keeping up with demand. From 2015 to 2019, the inventory-to-sales ratio for businesses in the U.S. averaged 1.40. Through the first four months of 2023 (the most recent data available), the ratio has returned to levels consistent with that pre-COVID average.
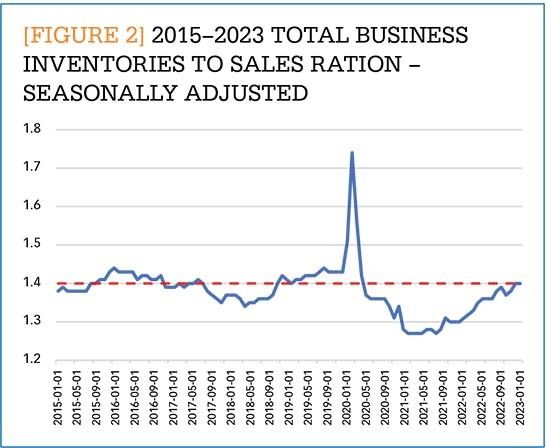
[FIGURE 2] 2015-2023 Total business inventories to sales ration - seasonally adjusted
Enlarge this image
Impact on supply chain capacity and costs
The return to normal will have several important impacts on supply chains. Many carriers built up capacity with an eye toward being able to handle the high levels of inventory moving through the system from 2020–2022. The excess freight capacity has clearly hurt some fleets, but it has also lowered prices for retailers, manufacturers, and consumers. Once again carriers find themselves in a situation similar to 2018–19 when we had a freight recession, but no recession in the overall economy. Eventually, however, supply and demand will rebalance, and prices should stabilize at lower levels than were seen from 2020–2022. The recent bankruptcy at Yellow that has eliminated the third-largest less-than-truckload carrier in the U.S. is evidence of the move back towards equilibrium in the freight industry.
Warehousing firms also built up capacity with 738.6 million square feet of new warehousing space coming online in 2020 and 2021. However, due to the slower rate at which warehousing can expand, we are not seeing a similar recession in this market. Despite the slowdown in the market, many firms are betting on future growth due to the continued long-term expansion of e-commerce. While its growth has slowed, e-commerce has remained elevated, which means that the service levels provided by more warehousing will be important going forward. The increase in the number of warehouse locations suggests that inventories will stay slightly higher than they were pre-pandemic.
We should, however, expect inventories to stay below their 2021–2022 highs for the foreseeable future. The move back towards normalcy is allowing some retailers to move back toward the just-in-time (JIT) inventory management systems used before the pandemic. One major difference now is that firms have worked hard over the last few years to shorten supply chains as well as diversify the supply base to become hardier in the face of disruptions. The waves of reshoring and nearshoring (in some industries) will allow supply chains to be more reactive to consumer demand and hopefully avoid some of the traps they fell into during 2021. Essentially, supply chains are attempting to balance the low-cost JIT systems they had before the pandemic with the more resilient portfolio approaches that allowed them to keep goods in stock during the pandemic. For many firms this seems to be taking the form of sourcing JIT inventories from multiple firms, in multiple regions, utilizing multiple ports and forms of transit. Pursuing a hybrid JIT/portfolio strategy should help firms to avoid the wild swings in inventory we saw over the last few years.
Future outlook
When asked to predict logistics activity over the next 12 months, LMI respondents predicted that inventory levels will begin to expand again, moving from contraction to a moderate expansionary rate of 53.7. This is a marked shift from what we saw through most of the spring when respondents were expecting contraction. An expansion rate of 53.7 suggests that firms will generally be replacing goods as they are sold, with overall inventories increasing at a slower, potentially more sustainable rate of growth. This optimism is at least partially due to lower inflation and increased consumer confidence. Things can always change, but at the moment it seems that the potential recession that scared many firms away from replenishing inventories has not come, and supply chains are looking to get back to business as usual.
Author’s note:For more insights like those presented above, see the LMI reports posted the first Tuesday of every month at: www.the-lmi.com.
Notes:
1. “June 2023 Manufacturing ISM Report on Business,” Institute for Supply Management (July 1, 2023): https://www.ismworld.org/supply-management-news-and-reports/reports/ism-report-on-business/pmi/june/
2. A. Shapiro, "Supply- and Demand-Driven PCE Inflation," Federal Reserve Bank of San Francisco (May 2023): https://www.frbsf.org/economic-research/indicators-data/supply-and-demand-driven-pce-inflation/


