The container shipping industry experienced an unparalleled surge during the pandemic; however, in 2023 so far, the market has been anaemic due to an oversupply of capacity and sluggish demand.
Freight demand has declined significantly after reaching its peak in September 2021, as consumers reduced their spending on luxury goods and the global economy grappled with inflation and rapid interest rate hikes. As a result, spot rates on significant trade routes have dropped rapidly.
Although shipping lines reported strong profit margins in Q1 of 2023 due to pre-negotiated contract rates, we anticipate a substantial decrease in these margins. As contract negotiations are currently underway, revised rates will soon come into effect, impacting the profitability of shipping lines in the second half of 2023 and throughout 2024.
While the drop in demand and rates are having an immediate effect on carriers’ profitability, the forthcoming influx of new ships will have a significant impact on the market for years to come.
Freefalling prices, surging costs
The year 2023 started with a significant oversupply of containers and high uncertainty in the market—which led to substantial container-price erosion. The average container prices have been freefalling, and there are no signs of revival as we approach the busiest period in the shipping industry. It is quite evident that this year’s peak season is almost invisible.
Container prices in June 2023 for major supply chain markets like China, Europe, and the U.S. reached their lowest average levels when compared to the same month in both 2022 and 2021. This decrease in container prices may suggest an additional burden on the profitability of shipping companies.
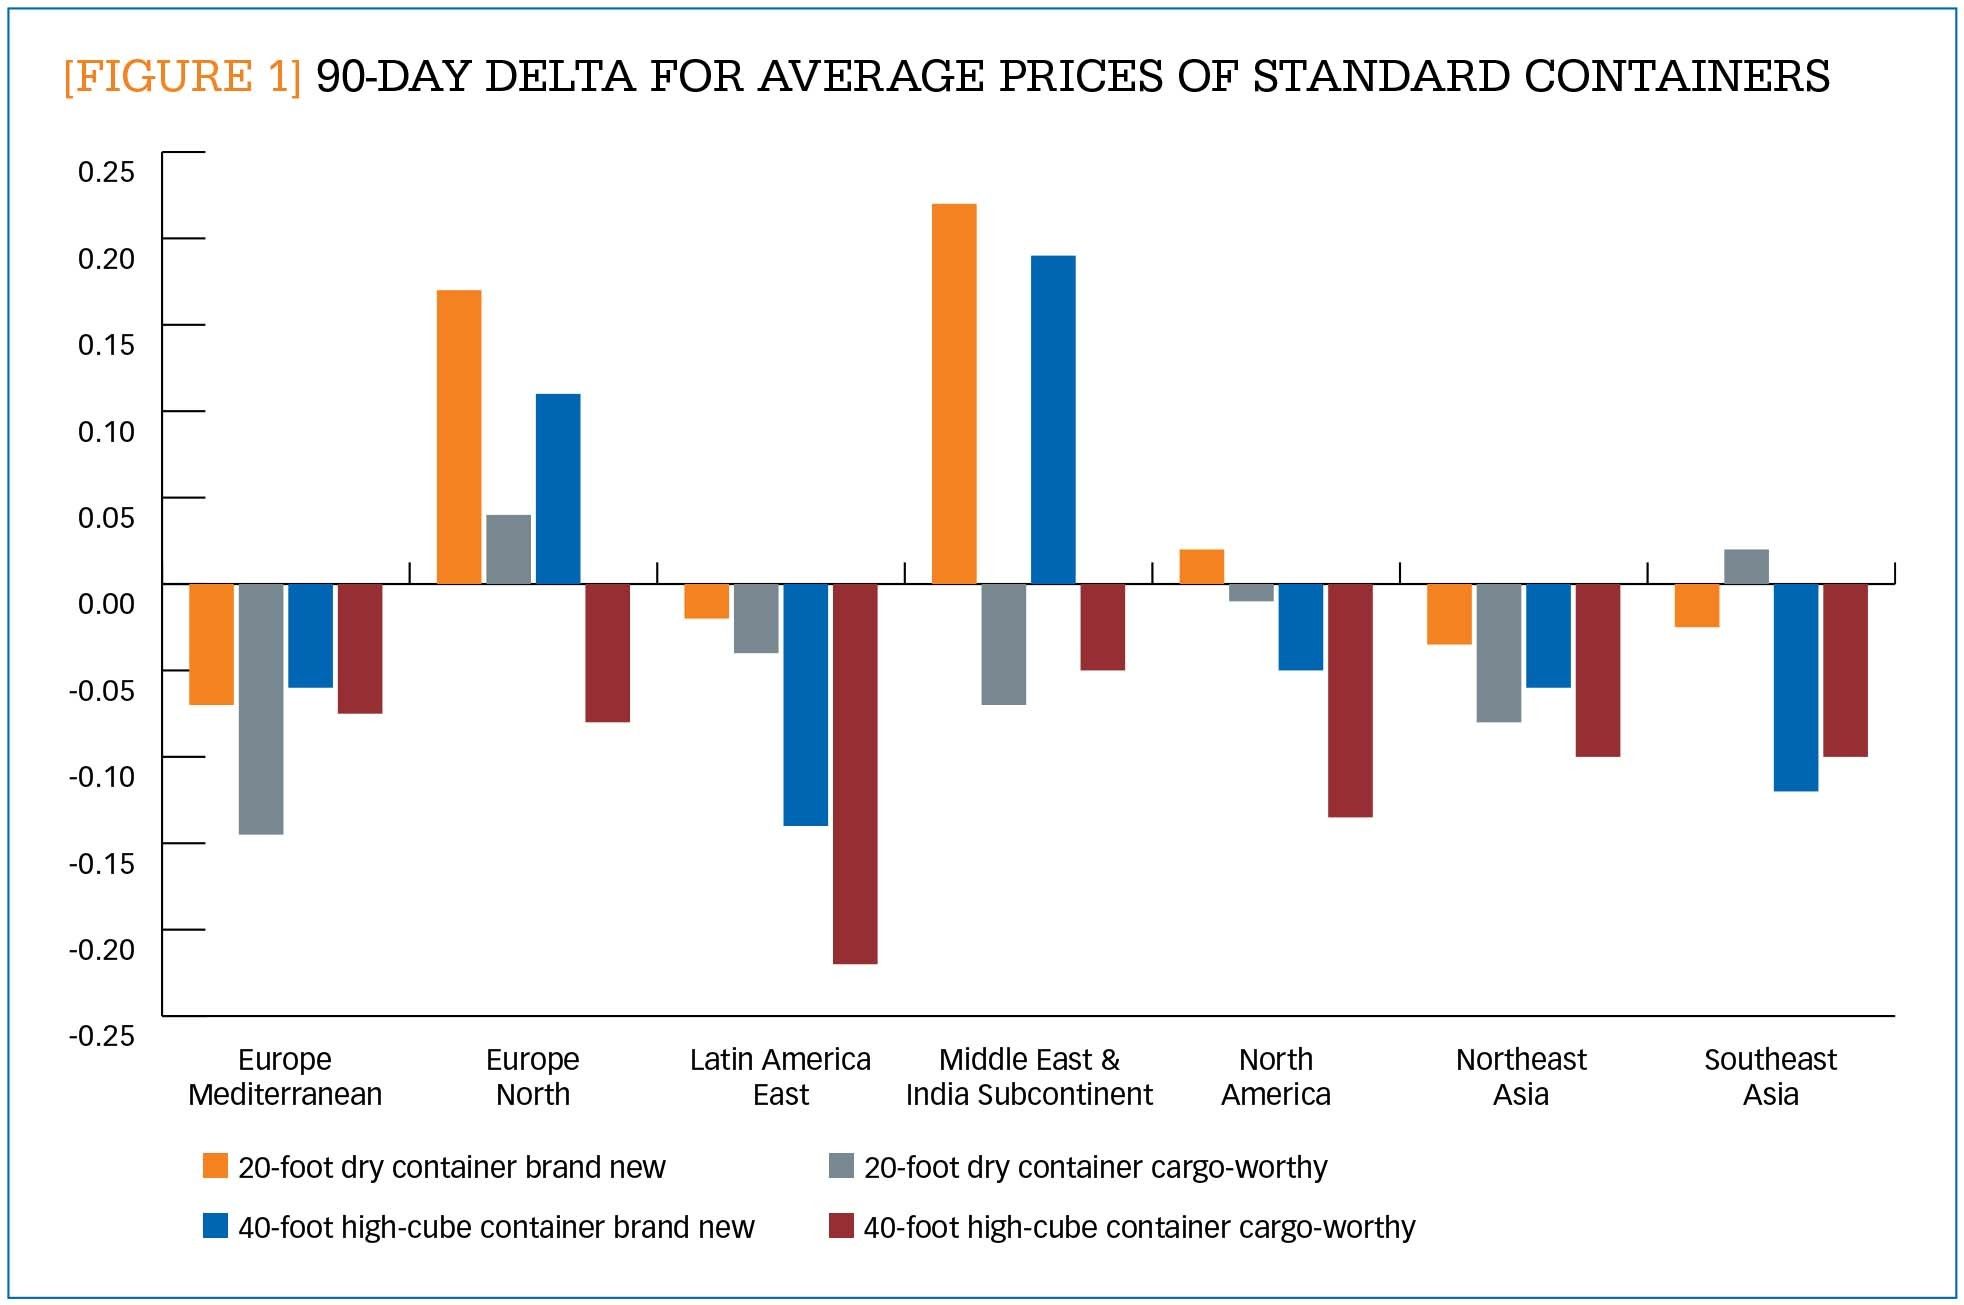
A recent study conducted by Container xChange examined the trends in average container prices for standard containers (new and cargo-worthy) during the second quarter of 2023 (April to June). The study found no significant rise in average container price for either new or cargo-worthy containers during Q2. Figure 1 shows the price development (or “delta”) of average containers on key routes during Q2 2023. Only Northern Europe and the Middle East and Indian Subcontinent regions experienced slight increases in prices. The rest of the regions showed negative (or near flat) trends for standard containers.
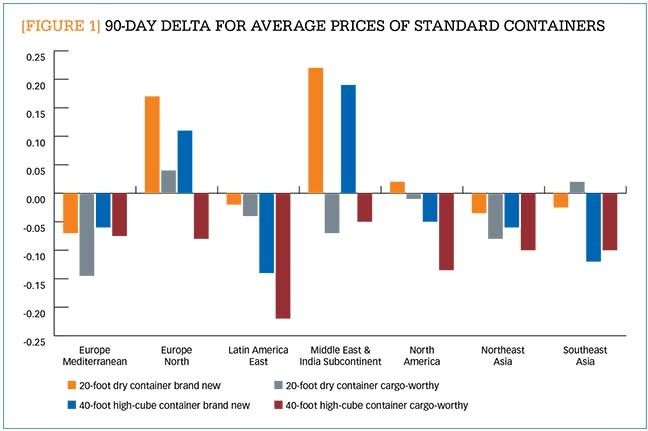
[FIGURE 1] 90-day delta for average prices of standard containers Enlarge this image
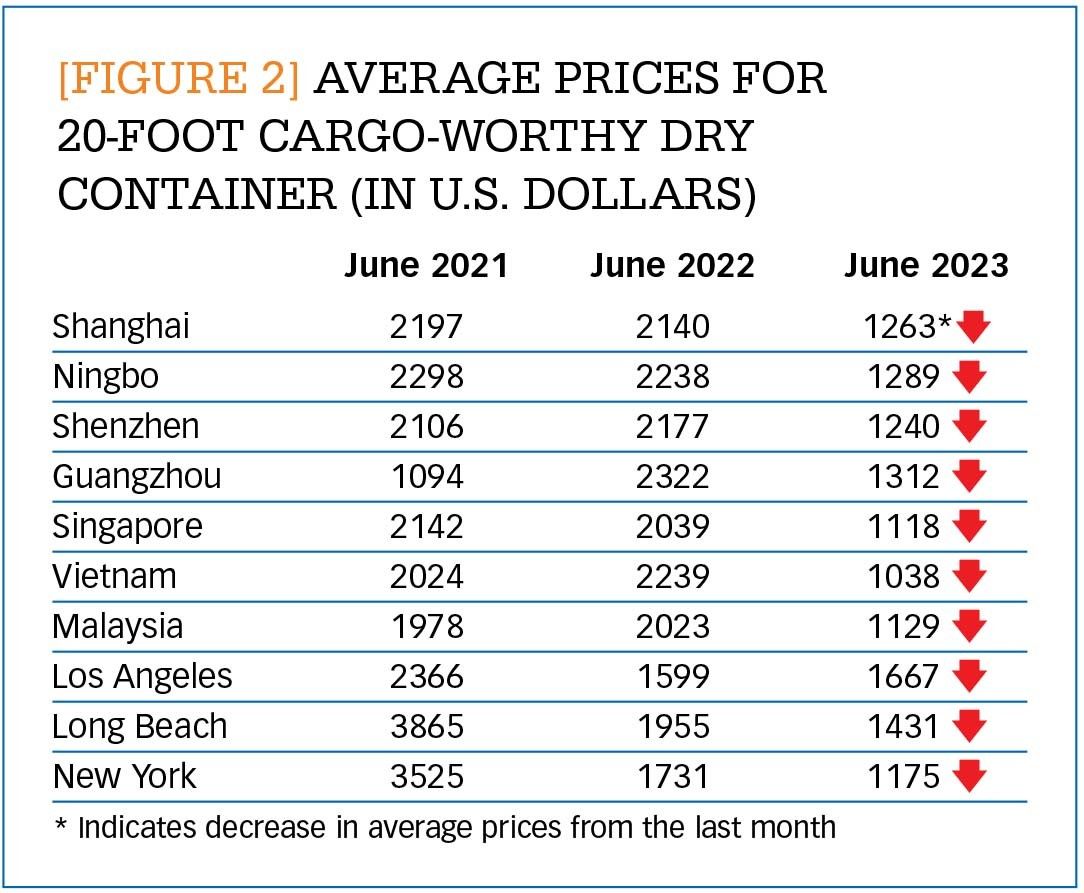
Figure 2 compares average container prices for some of the busiest ports in the world from the Container xChange platform. The prices have fallen to the lowest levels in the last three years of comparison. Clearly, the data indicates poor demand for containers in 2023 up to June.
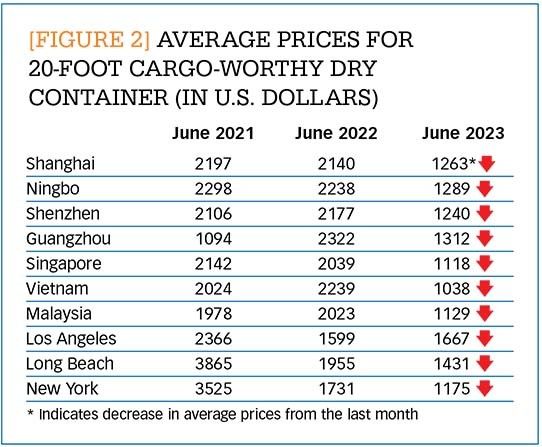
[FIGURE 2] Average prices for 20-foot cargo-worthy dry container (in U.S. dollars) Enlarge this image
While container prices have been dropping, operating expenses for container lines have been rising. The main reasons for this increase have been soaring energy prices and labor expenses, neither of which are expected to decrease soon. Additionally, the shipping industry is facing high demurrage and detention charges and various fees related to container storage and transfers. The shortage of container depot space also remains a persistent struggle, with depots charging exorbitant fees that pose additional burdens. Our customers have informed us about terminal tariff hikes in Europe and India, causing further concerns for carriers.
These rising operating costs will likely influence spot freight rates. In the intensely competitive container shipping industry, the minimum price offered in the market tends to align with variable costs. Over the years, variable costs in container transportation have risen by approximately 15% to 25% since 2019, varying depending on the specific trade route. Consequently, the lower threshold of freight rates set by carriers has also increased within the range of 15% to 25%. This presents challenges for shippers, as they now encounter higher variable costs when transporting goods. Despite the significant decrease in average container rates from 2021 to 2023, with a reduction of nearly 85%, the underlying variable costs remain elevated. As a result, it is unlikely that spot freight rates will experience a significant additional decline, as contract rates still have room for further depreciation and remain relatively stable.
Capacity takes center stage
The container shipping market’s recent good years prompted a surge of orders for new and larger container vessels. Research conducted by the maritime consulting company Drewry and the financial services company ING Group estimates that fleet capacity will be increased by 27% due to the new vessels being delivered between 2023 and 2025.1 More than 700 ships are expected to be delivered between 2023 and 2024, with an additional 150 coming in 2025, according to ING and Drewry. Among these orders, 45% are for Neo-Panamax size vessels (12,500-18,000 TEU or twenty-foot equivalent unit) and another 20% are for ultra-large container vessels (ULCV). Feeder vessels (up to 3,000 TEU) make up just over a third of the ordered vessels, representing 8% of the total capacity. The report says these investments are being driven not just by expected future demand but also by a desire among carriers to expand their fleet and introduce larger and more efficient vessels.
Indeed, it is unlikely that the additional capacity will be absorbed by increased demand any time soon. Moreover, as port congestion eases, previously blocked capacity is gradually being freed up. These supply chain improvements could significantly improve supply; especially considering that at the worst point in early 2022 up to 15% of capacity was tied up at the ports. The significant influx of new capacity, combined with sluggish trade growth, could potentially disrupt freight rates. And yet, we do not expect to see extensive order cancellations, as stakeholders will aim to preserve the efficiency gains they have made per unit carried.
That’s not to say that we won’t see capacity cuts. Container liners operating on the Asia–U.S. trade route, for example, have implemented a 14% reduction in capacity due to persistent weak demand and surplus capacity. And more capacity cuts may be on the way. While some container lines and analysts predicted a surge in cargo demand in August—driven by dwindling inventory stocks in the U.S. and the aftermath of recent port operation delays caused by the International Longshore and Warehouse Union (ILWU) strikes—that optimism has not been reflected at the ground level. Shippers, for their part, continue to observe weak demand, with only a slight increase in less-than-container load (LCL) shipments, indicating a lack of strong demand for full container load (FCL) shipments. Furthermore, many shippers have already adopted online spot rates, indicating a shift in their preferred approach to freight rate negotiations. To achieve rate stability, carriers will need to make more substantial capacity cuts, which will test their determination as they strive to push for rate increases in August.
Effective capacity management becomes crucial considering these circumstances. The container liners response to this uncertain scenario is yet to be seen. So far, liners have been driven to secure market share. Vessel utilization levels have already decreased (down to 75% in the first quarter), and freight rates have demonstrated fragility in the second quarter, with the potential for further decline. Given that container liners are financially strong, these circumstances could easily evolve into a prolonged price war.
Just 29% of supply chain organizations have the competitive characteristics they’ll need for future readiness, according to a Gartner survey released Tuesday. The survey focused on how organizations are preparing for future challenges and to keep their supply chains competitive.
Gartner surveyed 579 supply chain practitioners to determine the capabilities needed to manage the “future drivers of influence” on supply chains, which include artificial intelligence (AI) achievement and the ability to navigate new trade policies. According to the survey, the five competitive characteristics are: agility, resilience, regionalization, integrated ecosystems, and integrated enterprise strategy.
The survey analysis identified “leaders” among the respondents as supply chain organizations that have already developed at least three of the five competitive characteristics necessary to address the top five drivers of supply chain’s future.
Less than a third have met that threshold.
“Leaders shared a commitment to preparation through long-term, deliberate strategies, while non-leaders were more often focused on short-term priorities,” Pierfrancesco Manenti, vice president analyst in Gartner’s Supply Chain practice, said in a statement announcing the survey results.
“Most leaders have yet to invest in the most advanced technologies (e.g. real-time visibility, digital supply chain twin), but plan to do so in the next three-to-five years,” Manenti also said in the statement. “Leaders see technology as an enabler to their overall business strategies, while non-leaders more often invest in technology first, without having fully established their foundational capabilities.”
As part of the survey, respondents were asked to identify the future drivers of influence on supply chain performance over the next three to five years. The top five drivers are: achievement capability of AI (74%); the amount of new ESG regulations and trade policies being released (67%); geopolitical fight/transition for power (65%); control over data (62%); and talent scarcity (59%).
The analysis also identified four unique profiles of supply chain organizations, based on what their leaders deem as the most crucial capabilities for empowering their organizations over the next three to five years.
First, 54% of retailers are looking for ways to increase their financial recovery from returns. That’s because the cost to return a purchase averages 27% of the purchase price, which erases as much as 50% of the sales margin. But consumers have their own interests in mind: 76% of shoppers admit they’ve embellished or exaggerated the return reason to avoid a fee, a 39% increase from 2023 to 204.
Second, return experiences matter to consumers. A whopping 80% of shoppers stopped shopping at a retailer because of changes to the return policy—a 34% increase YoY.
Third, returns fraud and abuse is top-of-mind-for retailers, with wardrobing rising 38% in 2024. In fact, over two thirds (69%) of shoppers admit to wardrobing, which is the practice of buying an item for a specific reason or event and returning it after use. Shoppers also practice bracketing, or purchasing an item in a variety of colors or sizes and then returning all the unwanted options.
Fourth, returns come with a steep cost in terms of sustainability, with returns amounting to 8.4 billion pounds of landfill waste in 2023 alone.
“As returns have become an integral part of the shopper experience, retailers must balance meeting sky-high expectations with rising costs, environmental impact, and fraudulent behaviors,” Amena Ali, CEO of Optoro, said in the firm’s “2024 Returns Unwrapped” report. “By understanding shoppers’ behaviors and preferences around returns, retailers can create returns experiences that embrace their needs while driving deeper loyalty and protecting their bottom line.”
Facing an evolving supply chain landscape in 2025, companies are being forced to rethink their distribution strategies to cope with challenges like rising cost pressures, persistent labor shortages, and the complexities of managing SKU proliferation.
1. Optimize labor productivity and costs. Forward-thinking businesses are leveraging technology to get more done with fewer resources through approaches like slotting optimization, automation and robotics, and inventory visibility.
2. Maximize capacity with smart solutions. With e-commerce volumes rising, facilities need to handle more SKUs and orders without expanding their physical footprint. That can be achieved through high-density storage and dynamic throughput.
3. Streamline returns management. Returns are a growing challenge, thanks to the continued growth of e-commerce and the consumer practice of bracketing. Businesses can handle that with smarter reverse logistics processes like automated returns processing and reverse logistics visibility.
4. Accelerate order fulfillment with robotics. Robotic solutions are transforming the way orders are fulfilled, helping businesses meet customer expectations faster and more accurately than ever before by using autonomous mobile robots (AMRs and robotic picking.
5. Enhance end-of-line packaging. The final step in the supply chain is often the most visible to customers. So optimizing packaging processes can reduce costs, improve efficiency, and support sustainability goals through automated packaging systems and sustainability initiatives.
That clash has come as retailers have been hustling to adjust to pandemic swings like a renewed focus on e-commerce, then swiftly reimagining store experiences as foot traffic returned. But even as the dust settles from those changes, retailers are now facing renewed questions about how best to define their omnichannel strategy in a world where customers have increasing power and information.
The answer may come from a five-part strategy using integrated components to fortify omnichannel retail, EY said. The approach can unlock value and customer trust through great experiences, but only when implemented cohesively, not individually, EY warns.
The steps include:
1. Functional integration: Is your operating model and data infrastructure siloed between e-commerce and physical stores, or have you developed a cohesive unit centered around delivering seamless customer experience?
2. Customer insights: With consumer centricity at the heart of operations, are you analyzing all touch points to build a holistic view of preferences, behaviors, and buying patterns?
3. Next-generation inventory: Given the right customer insights, how are you utilizing advanced analytics to ensure inventory is optimized to meet demand precisely where and when it’s needed?
4. Distribution partnerships: Having ensured your customers find what they want where they want it, how are your distribution strategies adapting to deliver these choices to them swiftly and efficiently?
5. Real estate strategy: How is your real estate strategy interconnected with insights, inventory and distribution to enhance experience and maximize your footprint?
When approached cohesively, these efforts all build toward one overarching differentiator for retailers: a better customer experience that reaches from brand engagement and order placement through delivery and return, the EY study said. Amid continued volatility and an economy driven by complex customer demands, the retailers best set up to win are those that are striving to gain real-time visibility into stock levels, offer flexible fulfillment options and modernize merchandising through personalized and dynamic customer experiences.
Geopolitical rivalries, alliances, and aspirations are rewiring the global economy—and the imposition of new tariffs on foreign imports by the U.S. will accelerate that process, according to an analysis by Boston Consulting Group (BCG).
Without a broad increase in tariffs, world trade in goods will keep growing at an average of 2.9% annually for the next eight years, the firm forecasts in its report, “Great Powers, Geopolitics, and the Future of Trade.” But the routes goods travel will change markedly as North America reduces its dependence on China and China builds up its links with the Global South, which is cementing its power in the global trade map.
“Global trade is set to top $29 trillion by 2033, but the routes these goods will travel is changing at a remarkable pace,” Aparna Bharadwaj, managing director and partner at BCG, said in a release. “Trade lanes were already shifting from historical patterns and looming US tariffs will accelerate this. Navigating these new dynamics will be critical for any global business.”
To understand those changes, BCG modeled the direct impact of the 60/25/20 scenario (60% tariff on Chinese goods, a 25% on goods from Canada and Mexico, and a 20% on imports from all other countries). The results show that the tariffs would add $640 billion to the cost of importing goods from the top ten U.S. import nations, based on 2023 levels, unless alternative sources or suppliers are found.
In terms of product categories imported by the U.S., the greatest impact would be on imported auto parts and automotive vehicles, which would primarily affect trade with Mexico, the EU, and Japan. Consumer electronics, electrical machinery, and fashion goods would be most affected by higher tariffs on Chinese goods. Specifically, the report forecasts that a 60% tariff rate would add $61 billion to cost of importing consumer electronics products from China into the U.S.