Each month, this new column will track the supply chain performance of key companies in a specific industry group. First up: electronics and high tech.
While many executives talk about supply chain excellence, almost all would agree it's easier to talk about than to define.
In 2014, a small team at the research company Supply Chain Insights started a project to define excellence in a more objective and quantifiable way. After studying balance sheet patterns for 2,000 companies, we believe that supply chain excellence is defined both by improving year-over-year financial performance versus a peer group and by outperforming the industry on a portfolio of metrics that correlate closely to market capitalization. The metrics we selected were inventory turns, operating margin, and return on invested capital (ROIC).
While we often see companies performing well in one of the three metrics, we believe that supply chain excellence is based on the ability to drive improvement on the complete portfolio—improving all three metrics together. To help companies assess whether they are making progress on improving supply chain performance, we created the Supply Chain Index. The Index provides a score, which represents a company's ability to do three things: balance growth and return on invested capital (growth), improve both operating margin and inventory turns (strength), and provide reliable, predictable operating margins and inventory turns (resiliency). (For more information about the Supply Chain Index, see the Q3/2014 Supply Chain Quarterly article, "The Supply Chain Index: A new way to measure value.")
This is the first in series of columns looking at how companies in a specific industry group perform against these metrics. We are starting with the high tech and electronics industry.
In our general analysis, we were surprised to find how few companies were making balance sheet improvements. In our research, we found that nine out of 10 public companies were not progressing. They could drive improvement in either operating margin or inventory turns, but not both together. Additionally, we discovered that many companies were going backwards, with slippage in metrics performance in two of the key metrics of ROIC, as well as in costs (measured by operating margin), customer service, and inventory. For some, this was caused by uncontrolled complexity, while for others it was the lack of a clear operating strategy.
Surprisingly, the high-tech industry segment has made more progress than other industries in being able to drive improvement in all of the performance metrics. The industry's success has come despite significant obstacles, such as shorter lifecycles, deterioration in prices, rapid advancements in technology, and major shifts in product portfolios. The high-tech industry exemplifies the saying, "when the going gets tough, the tough get going."
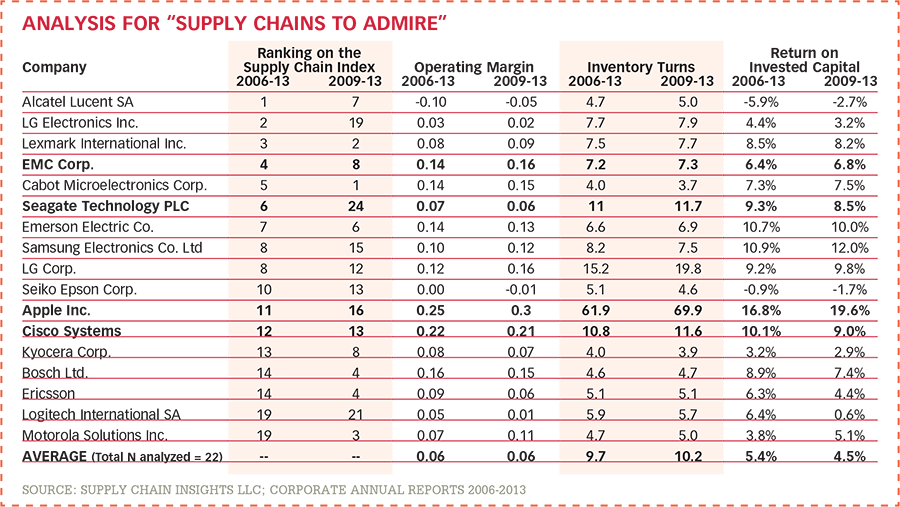
Who did it best? To identify the top performers, we developed a list of companies that were performing at levels above those of their peer group on the portfolio of metrics. Based on both supply chain improvement in this portfolio of metrics (as defined by the Supply Chain Index ranking) and performance on ROIC, operating margins, and inventory turns, Apple, Cisco Systems, EMC, and Seagate make Supply Chain Insights' "Supply Chains to Admire" list in high tech and electronics (see the accompanying table), while Intel and TSMC make the list in the semiconductor industries.
Economic activity in the logistics industry expanded in August, though growth slowed slightly from July, according to the most recent Logistics Manager’s Index report (LMI), released this week.
The August LMI registered 56.4, down from July’s reading of 56.6 but consistent with readings over the past four months. The August reading represents nine straight months of growth across the logistics industry.
The LMI is a monthly gauge of economic activity across warehousing, transportation, and logistics markets. An LMI above 50 indicates expansion, and a reading below 50 indicates contraction.
Inventory levels saw a marked change in August, increasing more than six points compared to July and breaking a three-month streak of contraction. The LMI researchers said this suggests that after running inventories down, companies are now building them back up in anticipation of fourth-quarter demand. It also represents a return to more typical growth patterns following the accelerated demand for logistics services during the Covid-19 pandemic and the lows of the recent freight recession.
“This suggests a return to traditional patterns of seasonality that we have not seen since pre-COVID,” the researchers wrote in the monthly LMI report, published Tuesday, adding that the buildup is somewhat tempered by increases in warehousing capacity and transportation capacity.
The LMI report is based on a monthly survey of logistics managers from across the country. It tracks industry growth overall and across eight areas: inventory levels and costs; warehousing capacity, utilization, and prices; and transportation capacity, utilization, and prices. The report is released monthly by researchers from Arizona State University, Colorado State University, Rochester Institute of Technology, Rutgers University, and the University of Nevada, Reno, in conjunction with the Council of Supply Chain Management Professionals (CSCMP).
With the economy slowing but still growing, and inflation down as the Federal Reserve prepares to lower interest rates, the United States appears to have dodged a recession, according to the National Retail Federation (NRF).
“The U.S. economy is clearly not in a recession nor is it likely to head into a recession in the home stretch of 2024,” NRF Chief Economist Jack Kleinhenz said in a release. “Instead, it appears that the economy is on the cusp of nailing a long-awaited soft landing with a simultaneous cooling of growth and inflation.”
Despite an “eventful August” with initial reports of rising unemployment and a slowdown in manufacturing, more recent data has “calmed fears of a deteriorating U.S. economy,” Kleinhenz said. “Concerns are now focused on the direction of the labor market and the possibility of a job market slowdown, but a recession is far less likely.”
That analysis is based on data in the NRF’s Monthly Economic Review, which said annualized gross domestic product growth for the second quarter has been revised upward to 3% from the original report of 2.8%. And consumer spending, the largest component of GDP, was revised up to 2.9% growth for the quarter from 2.3%.
Compared to its recent high point of 9.1% in July of 2022, inflation is nearly back to normal. Year-over-year growth in the Personal Consumption Expenditures Price Index – the Fed’s preferred measure of inflation – was at 2.5% in July, unchanged from June and only half a percentage point above the Fed’s target of 2%.
The labor market “is not terribly weak” but “is showing signs of tottering,” Kleinhenz said. Only 114,000 jobs were added in July, lower than expected, and the unemployment rate rose to 4.3% from 4.1% in June. Despite the increase, the unemployment rate is still within the normal range, Kleinhenz said.
“Now the guessing game begins on the magnitude and frequency of rate cuts and how far the federal funds rate will be reduced,” Kleinhenz said. “While lowering interest rates would be good news, it takes time for rate reductions to work their way through the various credit channels and the economy as a whole. Consequently, a reduction is not expected to provide an immediate uplift to the economy but would stabilize current conditions.”
Going forward, Kleinhenz said lower rates should benefit households under pressure from loans used to meet daily needs. Lower rates will also make it more affordable to borrow through mortgages, home improvement loans, car loans, and credit cards, encouraging spending and increasing demand for goods and services. Small businesses would also benefit, since lower intertest rates could lower their financing costs on existing loans or allow them to take out new loans to invest in equipment and plants or to hire more workers.
The global air cargo market’s hot summer of double-digit demand growth continued in August with average spot rates showing their largest year-on-year jump with a 24% increase, according to the latest weekly analysis by Xeneta.
Xeneta cited two reasons to explain the increase. First, Global average air cargo spot rates reached $2.68 per kg in August due to continuing supply and demand imbalance. That came as August's global cargo supply grew at its slowest ratio in 2024 to-date at 2% year-on-year, while global cargo demand continued its double-digit growth, rising +11%.
The second reason for higher rates was an ocean-to-air shift in freight volumes due to Red Sea disruptions and e-commerce demand.
Those factors could soon be amplified as e-commerce shows continued strong growth approaching the hotly anticipated winter peak season. E-commerce and low-value goods exports from China in the first seven months of 2024 increased 30% year-on-year, including shipments to Europe and the US rising 38% and 30% growth respectively, Xeneta said.
“Typically, air cargo market performance in August tends to follow the July trend. But another month of double-digit demand growth and the strongest rate growths of the year means there was definitely no summer slack season in 2024,” Niall van de Wouw, Xeneta’s chief airfreight officer, said in a release.
“Rates we saw bottoming out in late July started picking up again in mid-August. This is too short a period to call a season. This has been a busy summer, and now we’re at the threshold of Q4, it will be interesting to see what will happen and if all the anticipation of a red-hot peak season materializes,” van de Wouw said.
“Unrelenting labor shortages and wage inflation, accompanied by increasing consumer demand, are driving rapid market adoption of autonomous technologies in manufacturing, warehousing, and logistics,” Seegrid CEO and President Joe Pajer said in a release. “This is particularly true in the area of palletized material flows; areas that are addressed by Seegrid’s autonomous tow tractors and lift trucks. This segment of the market is just now ‘coming into its own,’ and Seegrid is a clear leader.”
According to Pajer, Seegrid’s strength in the sector is due to several new technologies it has released in the past six months. They include: Sliding Scale Autonomy, which provides both flexibility and predictability in autonomous navigation and manipulation; Enhanced Pallet and Payload Detection, which enables reliable recognition and manipulation of a broad range of payloads; and the planned launch of its CR1 autonomous lift truck model later this year.
Seegrid’s CR1 unit offers a 15-foot lift height, 4,000-pound load capacity, and a top speed of 5 mph. In comparison, its existing autonomous lift truck model, the RS1, supports six-foot lift height, 3,500 pound capacity, and the same top speed.
The “series D” investment round was funded by existing lead investors Giant Eagle Incorporated and G2 Venture Partners, as well as smaller investments from other existing shareholders.
The report cites data showing that there are approximately 1.7 million workers missing from the post-pandemic workforce and that 38% of small firms are unable to fill open positions. At the same time, the “skills gap” in the workforce is accelerating as automation and AI create significant shifts in how work is performed.
That information comes from the “2024 Labor Day Report” released by Littler’s Workplace Policy Institute (WPI), the firm’s government relations and public policy arm.
“We continue to see a labor shortage and an urgent need to upskill the current workforce to adapt to the new world of work,” said Michael Lotito, Littler shareholder and co-chair of WPI. “As corporate executives and business leaders look to the future, they are focused on realizing the many benefits of AI to streamline operations and guide strategic decision-making, while cultivating a talent pipeline that can support this growth.”
But while the need is clear, solutions may be complicated by public policy changes such as the upcoming U.S. general election and the proliferation of employment-related legislation at the state and local levels amid Congressional gridlock.
“We are heading into a contentious election that has already proven to be unpredictable and is poised to create even more uncertainty for employers, no matter the outcome,” Shannon Meade, WPI’s executive director, said in a release. “At the same time, the growing patchwork of state and local requirements across the U.S. is exacerbating compliance challenges for companies. That, coupled with looming changes following several Supreme Court decisions that have the potential to upend rulemaking, gives C-suite executives much to contend with in planning their workforce-related strategies.”